正在加载图片...

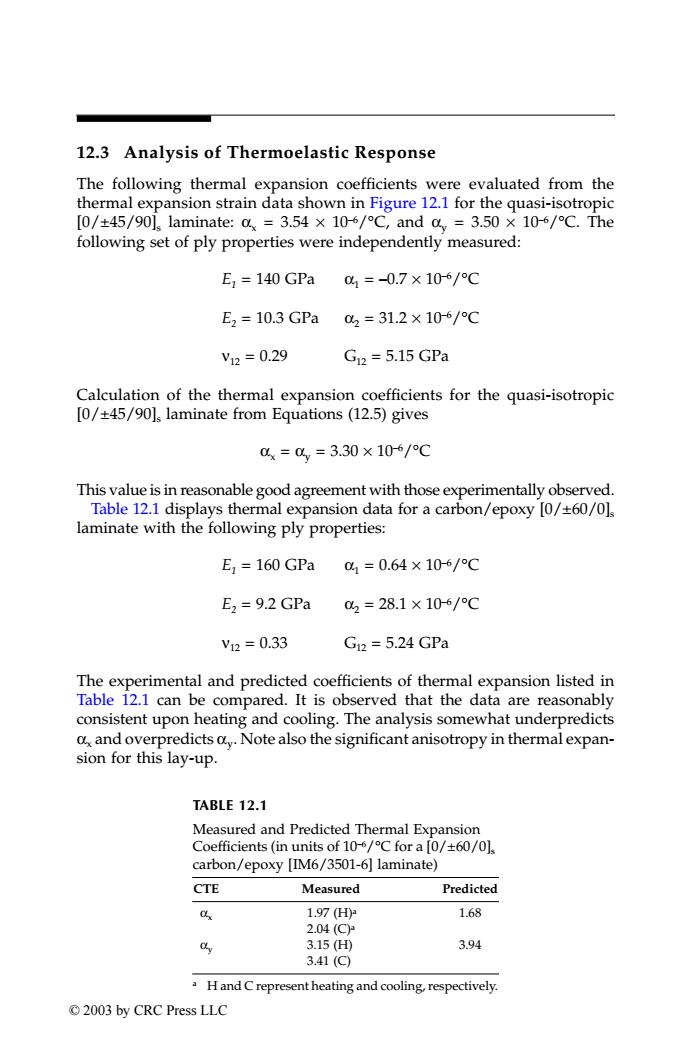
12.3 Analysis of Thermoelastic Response The following thermal expansion coefficients were evaluated from the thermal expansion strain data shown in Figure 12.1 for the quasi-isotropic [0/±45/90l,laminate::a=3.54×106/C,anda,=3.50×10-6/℃.The following set of ply properties were independently measured: E1=140GPa41=-0.7×10⁶/C E2=10.3GPa02=31.2×10⁶/°C V12=0.29 G2=5.15GPa Calculation of the thermal expansion coefficients for the quasi-isotropic [0/+45/90]s laminate from Equations (12.5)gives 0x=0=3.30×10/C This value is in reasonable good agreement with those experimentally observed. Table 12.1 displays thermal expansion data for a carbon/epoxy [0/+60/0]s laminate with the following ply properties: E,=160GPa%1=0.64×10⁻⁶/C E,=9.2 GPa 02=28.1×10⁶/C V12=0.33 G12=5.24GPa The experimental and predicted coefficients of thermal expansion listed in Table 12.1 can be compared.It is observed that the data are reasonably consistent upon heating and cooling.The analysis somewhat underpredicts o and overpredicts a.Note also the significant anisotropy in thermal expan- sion for this lay-up. TABLE 12.1 Measured and Predicted Thermal Expansion Coefficients (in units of 10-/C for a [0/+60/0] carbon/epoxy [IM6/3501-6]laminate) CTE Measured Predicted 04 1.97(H) 1.68 2.04(C 04 3.15(H) 3.94 3.41(C) Hand C represent heating and cooling,respectively. ©2003 by CRC Press LLC12.3 Analysis of Thermoelastic Response The following thermal expansion coefficients were evaluated from the thermal expansion strain data shown in Figure 12.1 for the quasi-isotropic [0/±45/90]s laminate: αx = 3.54 × 10⁻⁶/°C, and αy = 3.50 × 10⁻⁶/°C. The following set of ply properties were independently measured: E1 = 140 GPa α1 = –0.7 × 10⁻⁶/°C E2 = 10.3 GPa α2 = 31.2 × 10⁻⁶/°C ν12 = 0.29 G12 = 5.15 GPa Calculation of the thermal expansion coefficients for the quasi-isotropic [0/±45/90]s laminate from Equations (12.5) gives αx = αy = 3.30 × 10⁻⁶/°C This value is in reasonable good agreement with those experimentally observed. Table 12.1 displays thermal expansion data for a carbon/epoxy [0/±60/0]s laminate with the following ply properties: E1 = 160 GPa α1 = 0.64 × 10⁻⁶/°C E2 = 9.2 GPa α2 = 28.1 × 10⁻⁶/°C ν12 = 0.33 G12 = 5.24 GPa The experimental and predicted coefficients of thermal expansion listed in Table 12.1 can be compared. It is observed that the data are reasonably consistent upon heating and cooling. The analysis somewhat underpredicts αx and overpredicts αy. Note also the significant anisotropy in thermal expansion for this lay-up. TABLE 12.1 Measured and Predicted Thermal Expansion Coefficients (in units of 10–6/°C for a [0/±60/0]s carbon/epoxy [IM6/3501-6] laminate) CTE Measured Predicted αx 1.97 (H)a 2.04 (C)a 1.68 αy 3.15 (H) 3.41 (C) 3.94 a H and C represent heating and cooling, respectively. TX001_ch12_Frame Page 166 Saturday, September 21, 2002 5:05 AM © 2003 by CRC Press LLC