正在加载图片...
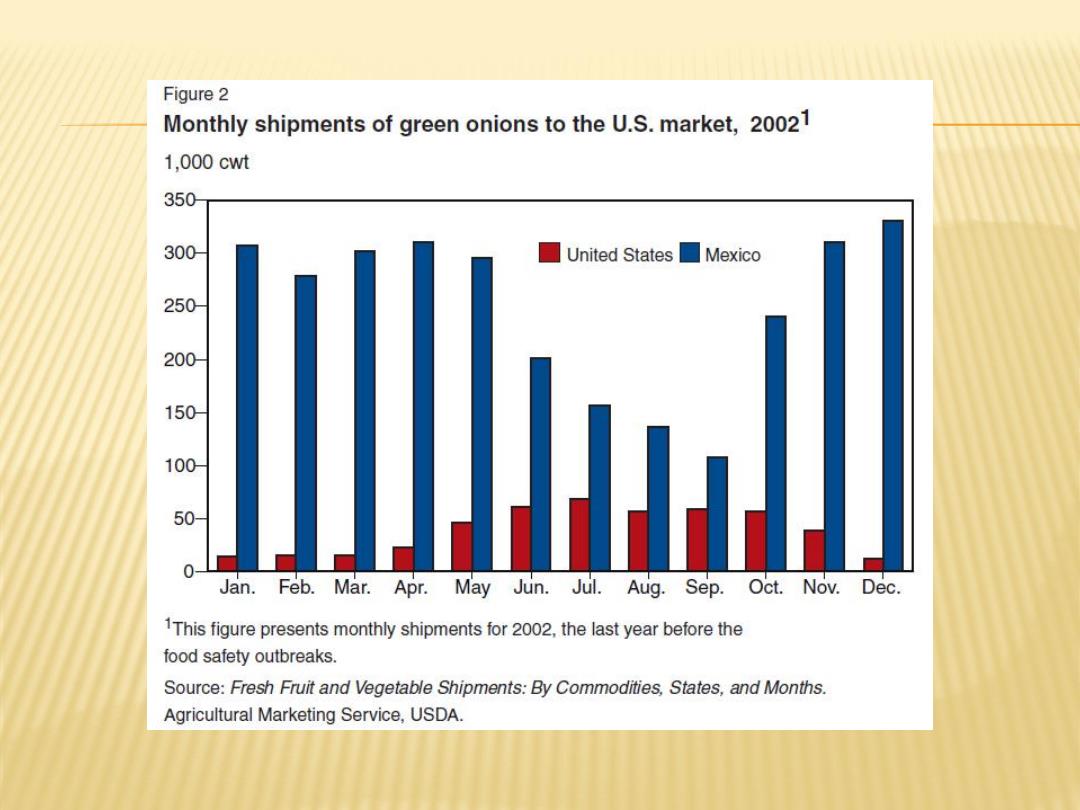
Figure 2 Monthly shipments of green onions to the U.S.market,20021 1,000cwt 350 300- ☐United States■Mexico 250 200- 150 100 50- 0- Jan.Feb.Mar.Apr.May Jun.Jul.Aug.Sep.Oct.Nov.Dec. 1This figure presents monthly shipments for 2002,the last year before the food safety outbreaks. Source:Fresh Fruit and Vegetable Shipments:By Commodities,States,and Months. Agricultural Marketing Service,USDA