
SUPPL.ECONQMICS OF FOOD SAFETY 食品安全的经济学
WARM-UP ×Group Discussion 1.What is the main hazard in this case? 2. What is the workflow of US CDC and FDA in this outbreak?Are there any differences for CDC and FDA's priorities? 3. How much economic loss was involved in this case? 4. What's the impact difference between GAP vs. non-GAP farmers? 5. Why should we choose GAPs?Why not?
Group Discussion 1. What is the main hazard in this case? 2. What is the workflow of US CDC and FDA in this outbreak? Are there any differences for CDC and FDA’s priorities? 3. How much economic loss was involved in this case? 4. What’s the impact difference between GAP vs. non-GAP farmers? 5. Why should we choose GAPs? Why not?
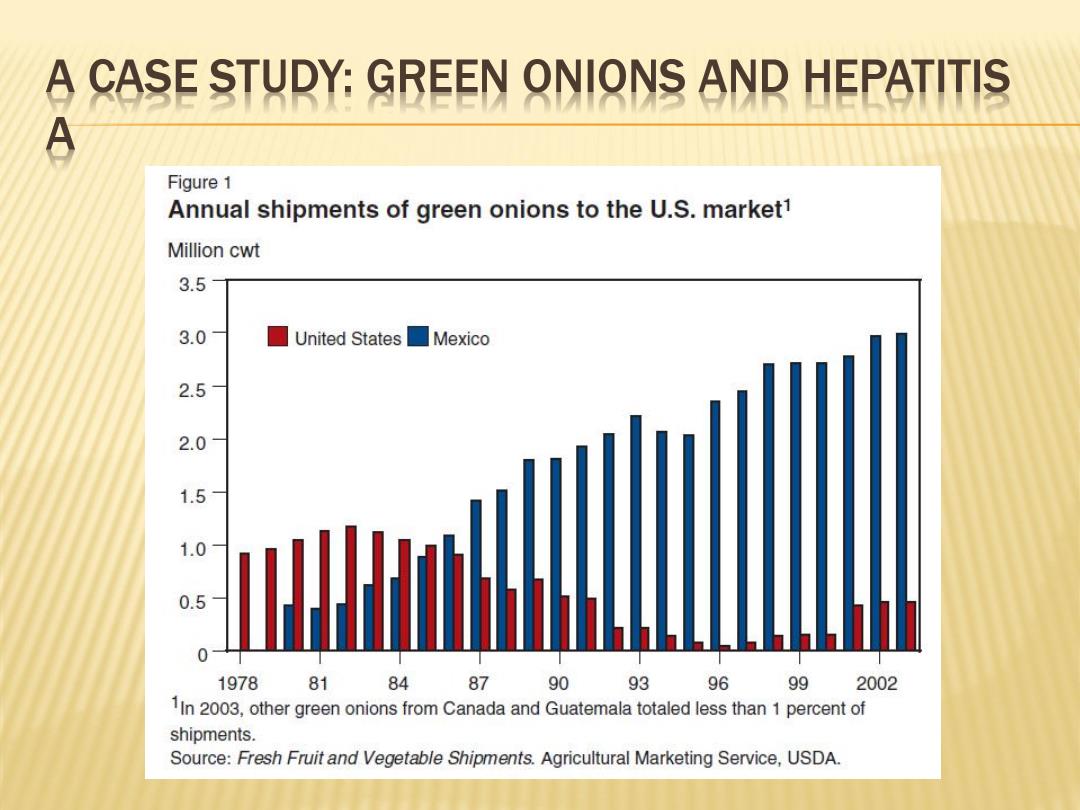
A CASE STUDY:GREEN QNIONS AND HEPATITIS A Figure 1 Annual shipments of green onions to the U.S.market1 Million cwt 3.5 3.0 ☐United States ☐Mexico 2.5 2.0 1.5 1.0 0.5 0 1978 81 84 87 9093 96 99 2002 1In 2003,other green onions from Canada and Guatemala totaled less than 1 percent of shipments. Source:Fresh Fruit and Vegetable Shipments.Agricultural Marketing Service,USDA
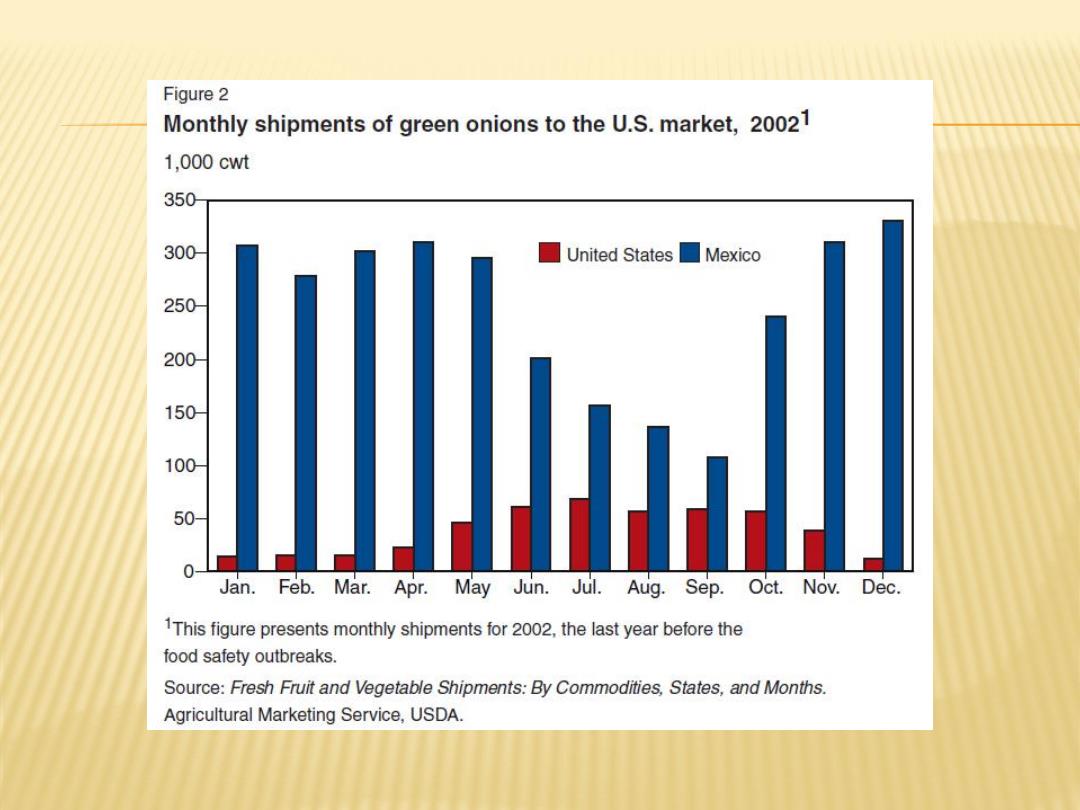
Figure 2 Monthly shipments of green onions to the U.S.market,20021 1,000cwt 350 300- ☐United States■Mexico 250 200- 150 100 50- 0- Jan.Feb.Mar.Apr.May Jun.Jul.Aug.Sep.Oct.Nov.Dec. 1This figure presents monthly shipments for 2002,the last year before the food safety outbreaks. Source:Fresh Fruit and Vegetable Shipments:By Commodities,States,and Months. Agricultural Marketing Service,USDA

Figure 3 Green onion production areas in Baja California and Sonora,Mexico San Diego Mexicali Sonora Mexico Baja California ●Winter Production ●Summer Production Source:Economic Research Service,USDA
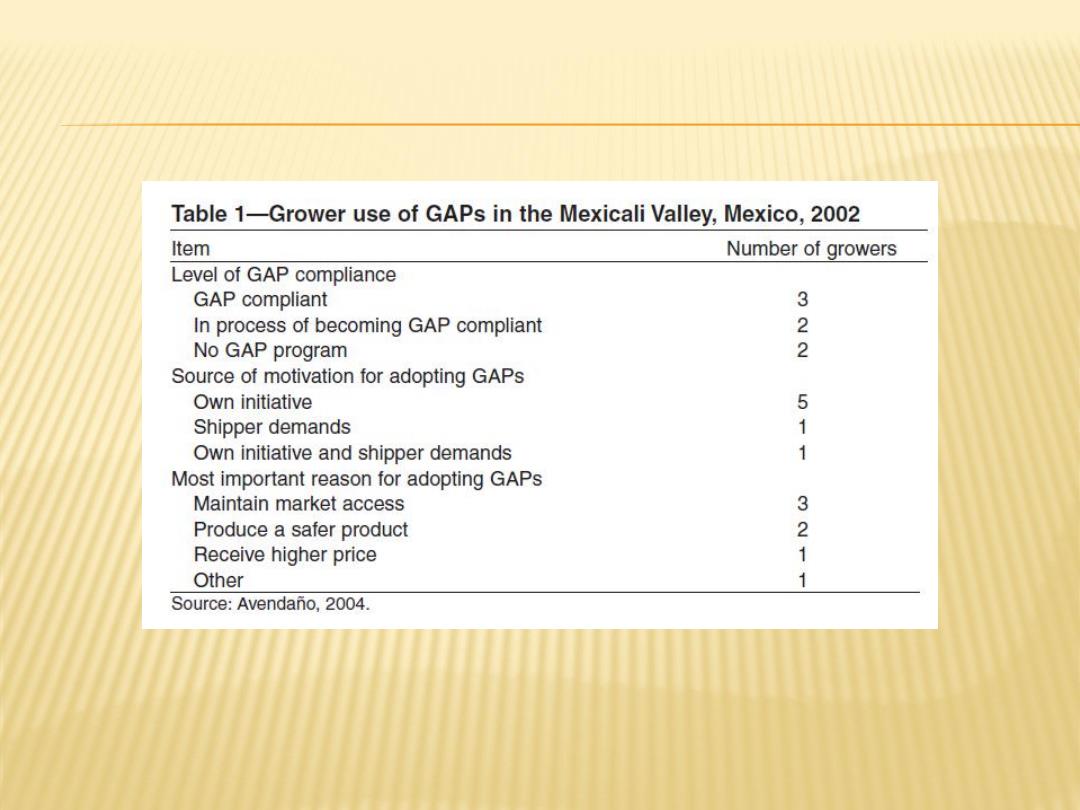
Table 1-Grower use of GAPs in the Mexicali Valley,Mexico,2002 Item Number of growers Level of GAP compliance GAP compliant 3 In process of becoming GAP compliant No GAP program 2 Source of motivation for adopting GAPs Own initiative 5 Shipper demands 1 Own initiative and shipper demands Most important reason for adopting GAPs Maintain market access 3 Produce a safer product 2 Receive higher price Other Source:Avendano,2004
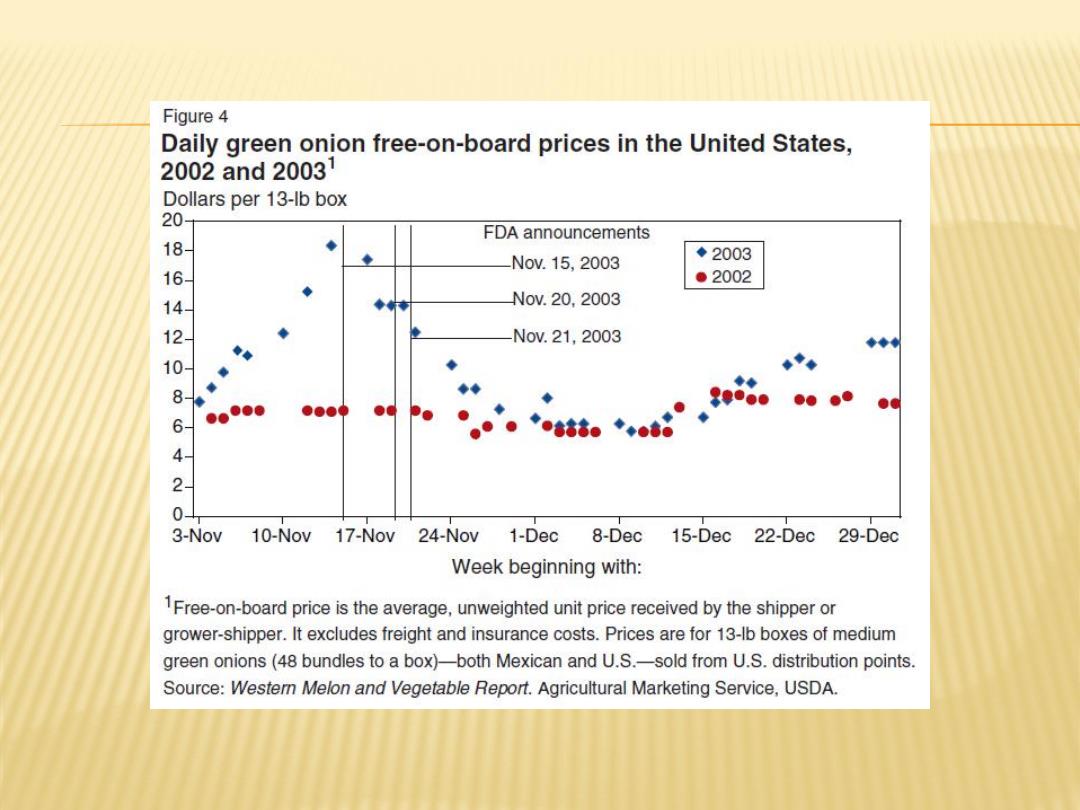
Figure 4 Daily green onion free-on-board prices in the United States, 2002and20031 Dollars per 13-lb box 20- FDA announcements NoV.15,2003 ◆2003 ●2002 864208642 Nov.20.2003 NoV.21,2003 0- 3-Nov 10-Nov 17-Nov 24-Nov 1-Dec 8-Dec 15-Dec 22-Dec 29-Dec Week beginning with: 1Free-on-board price is the average,unweighted unit price received by the shipper or grower-shipper.It excludes freight and insurance costs.Prices are for 13-Ib boxes of medium green onions(48 bundles to a box)-both Mexican and U.S.-sold from U.S.distribution points. Source:Western Melon and Vegetable Report.Agricultural Marketing Service,USDA

Figure 5 Weekly U.S.and Mexican green onion shipments, 2002/03and2003/04 Thousand 13-lb boxes 800 700- Mexican-2002/03 600- 500- 400- 300 Mexican-2003/04 200- U.S.-2002/03 U.S.-2003/04 100- 0 31-Aug. 12-0ct. 23-Nov. 4-Jan. 15-Feb. 28-Mar 9-May 20-Jun. Week beginning with: Source:Fresh Fruits,Vegetables,and Ornamental Crops:Weekly Summary Shipments.Agricultural Marketing Service,USDA

Table 2-Impact of food safety outbreak on Mexican growers, by GAP status Impact on: GAP status Volume of green onion sales Demand for other products GAPs Fairly constant No impact Partial GAPs Down a bit Some impact No GAPs Down by 50 percent Down by about 30 percent No GAPs and named No sales and most fields Shippers stopped by FDA plowed under selling all or almost all products from these growers Source:Avendano and Calvin(2004)
ECONOMIC LOSS For the 2-week period November 16-29,2003 estimated losses for Mexican growers, considering lost sales and lower prices on actual sales,totaled $10.5 million. This loss is just estimated from the farmers view.What about the retailers,the consumers and the government?
For the 2-week period November 16-29, 2003, estimated losses for Mexican growers, considering lost sales and lower prices on actual sales, totaled $10.5 million. This loss is just estimated from the farmers’ view. What about the retailers, the consumers and the government?