正在加载图片...
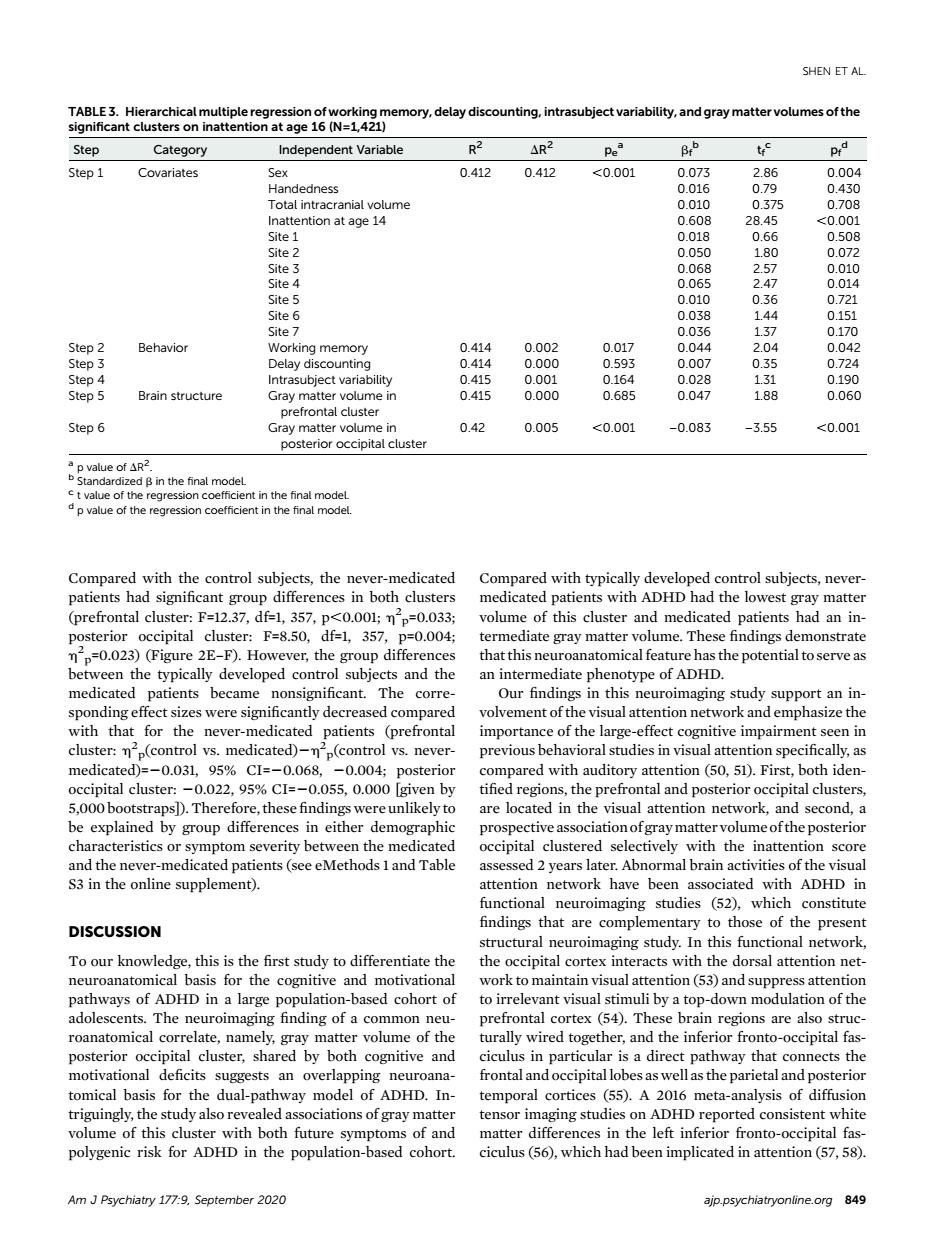
SHEN ET AL Step Category Independent Variable R2 △R2 B Step1 Covariates 0.412 0.412 <0.001 ioinaciamnulvoume ntion at age 14 Behavior Brain structure Gray matter volume in Step6 0.42 0.005 <0001 -0.083 -355 <0.001 posterior occipital cluster pvalue fR B in the final mode pvauecftheegresioncoeheentinhefmlmod Compared with the control subiects.the neve medicated Compared with typically developed control subiects.never patients had significant group differences in both clusters medicated patients with ADHD had the lowest gray matter (prefrontal cluster:F=12.37,df=1,357,p<0.001;np=0.033; volume of this cluster and medicated patients had an in- F=8.50, 357 and the medicated patients became nonsignificant.The corre. Our findings in this neuroimaging study support an in- sponding effect sizes were significantly decreased compared volvement of the visual attention network and emphasize the with that for the -0.031,95%CI=-0.068 0.004 d with audito attention (50.51.Fi occipital cluster:-0.02,%CI=-0.055,0.000 given by fieugoAhcpreOntaandposeriorocptaPdeies 5,000 bootstrapsD).Therefore,these findings wereunlikely to are located in the visual attention network,and second,a iation of gray m un neofthe posterio S3 in the online supplement). attention network have been associated with ADHD in unctionl neuroimaging studies (52),which constitute DISCUSSION nat are con se of the presen To our knowledge,this is the first study to differentiate the inital cortey inter with the do sal attention ne neuroanatomical basis for the cognitive and motivational work to maintain visual attention(53)and suppress attention to irrelevant visual stimuli by a top-down modulation of the (54).T n regions are also struc ciculus in particular is a direct pathway that connects the motivational deficits suggests an overlapping neuroana- frontal and occipital lobesas wellas the parietal and posterior tomical basis for the dual-pathway model of ADHD.In emporal cortices (55).A 2016 meta-analysis of diffusion the study also rev sociations of gray matte ensor imaging studies on ADH eported cons nt whi Am JPsychiatry 1779.September 2020 Compared with the control subjects, the never-medicated patients had significant group differences in both clusters (prefrontal cluster: F=12.37, df=1, 357, p,0.001; h2 p=0.033; posterior occipital cluster: F=8.50, df=1, 357, p=0.004; h2 p=0.023) (Figure 2E–F). However, the group differences between the typically developed control subjects and the medicated patients became nonsignificant. The corresponding effect sizes were significantly decreased compared with that for the never-medicated patients (prefrontal cluster: h2 p(control vs. medicated)2h2 p(control vs. nevermedicated)=20.031, 95% CI=20.068, 20.004; posterior occipital cluster: 20.022, 95% CI=20.055, 0.000 [given by 5,000 bootstraps]). Therefore, these findings were unlikely to be explained by group differences in either demographic characteristics or symptom severity between the medicated and the never-medicated patients (see eMethods 1 and Table S3 in the online supplement). DISCUSSION To our knowledge, this is the first study to differentiate the neuroanatomical basis for the cognitive and motivational pathways of ADHD in a large population-based cohort of adolescents. The neuroimaging finding of a common neuroanatomical correlate, namely, gray matter volume of the posterior occipital cluster, shared by both cognitive and motivational deficits suggests an overlapping neuroanatomical basis for the dual-pathway model of ADHD. Intriguingly, the study also revealed associations of gray matter volume of this cluster with both future symptoms of and polygenic risk for ADHD in the population-based cohort. Compared with typically developed control subjects, nevermedicated patients with ADHD had the lowest gray matter volume of this cluster and medicated patients had an intermediate gray matter volume. These findings demonstrate that this neuroanatomical feature has the potential to serve as an intermediate phenotype of ADHD. Our findings in this neuroimaging study support an involvement of the visual attention network and emphasize the importance of the large-effect cognitive impairment seen in previous behavioral studies in visual attention specifically, as compared with auditory attention (50, 51). First, both identified regions, the prefrontal and posterior occipital clusters, are located in the visual attention network, and second, a prospective association of graymatter volume of the posterior occipital clustered selectively with the inattention score assessed 2 years later. Abnormal brain activities of the visual attention network have been associated with ADHD in functional neuroimaging studies (52), which constitute findings that are complementary to those of the present structural neuroimaging study. In this functional network, the occipital cortex interacts with the dorsal attention network to maintain visual attention (53) and suppress attention to irrelevant visual stimuli by a top-down modulation of the prefrontal cortex (54). These brain regions are also structurally wired together, and the inferior fronto-occipital fasciculus in particular is a direct pathway that connects the frontal and occipital lobes as well as the parietal and posterior temporal cortices (55). A 2016 meta-analysis of diffusion tensor imaging studies on ADHD reported consistent white matter differences in the left inferior fronto-occipital fasciculus (56), which had been implicated in attention (57, 58). TABLE 3. Hierarchical multiple regression of working memory, delay discounting, intrasubject variability, and gray matter volumes of the significant clusters on inattention at age 16 (N=1,421) Step Category Independent Variable R2 DR2 pe a bf b tf c pf d Step 1 Covariates Sex 0.412 0.412 ,0.001 0.073 2.86 0.004 Handedness 0.016 0.79 0.430 Total intracranial volume 0.010 0.375 0.708 Inattention at age 14 0.608 28.45 ,0.001 Site 1 0.018 0.66 0.508 Site 2 0.050 1.80 0.072 Site 3 0.068 2.57 0.010 Site 4 0.065 2.47 0.014 Site 5 0.010 0.36 0.721 Site 6 0.038 1.44 0.151 Site 7 0.036 1.37 0.170 Step 2 Behavior Working memory 0.414 0.002 0.017 0.044 2.04 0.042 Step 3 Delay discounting 0.414 0.000 0.593 0.007 0.35 0.724 Step 4 Intrasubject variability 0.415 0.001 0.164 0.028 1.31 0.190 Step 5 Brain structure Gray matter volume in prefrontal cluster 0.415 0.000 0.685 0.047 1.88 0.060 Step 6 Gray matter volume in posterior occipital cluster 0.42 0.005 ,0.001 –0.083 –3.55 ,0.001 a p value of DR2 . b Standardized b in the final model. c t value of the regression coefficient in the final model. d p value of the regression coefficient in the final model. Am J Psychiatry 177:9, September 2020 ajp.psychiatryonline.org 849 SHEN ET AL