正在加载图片...
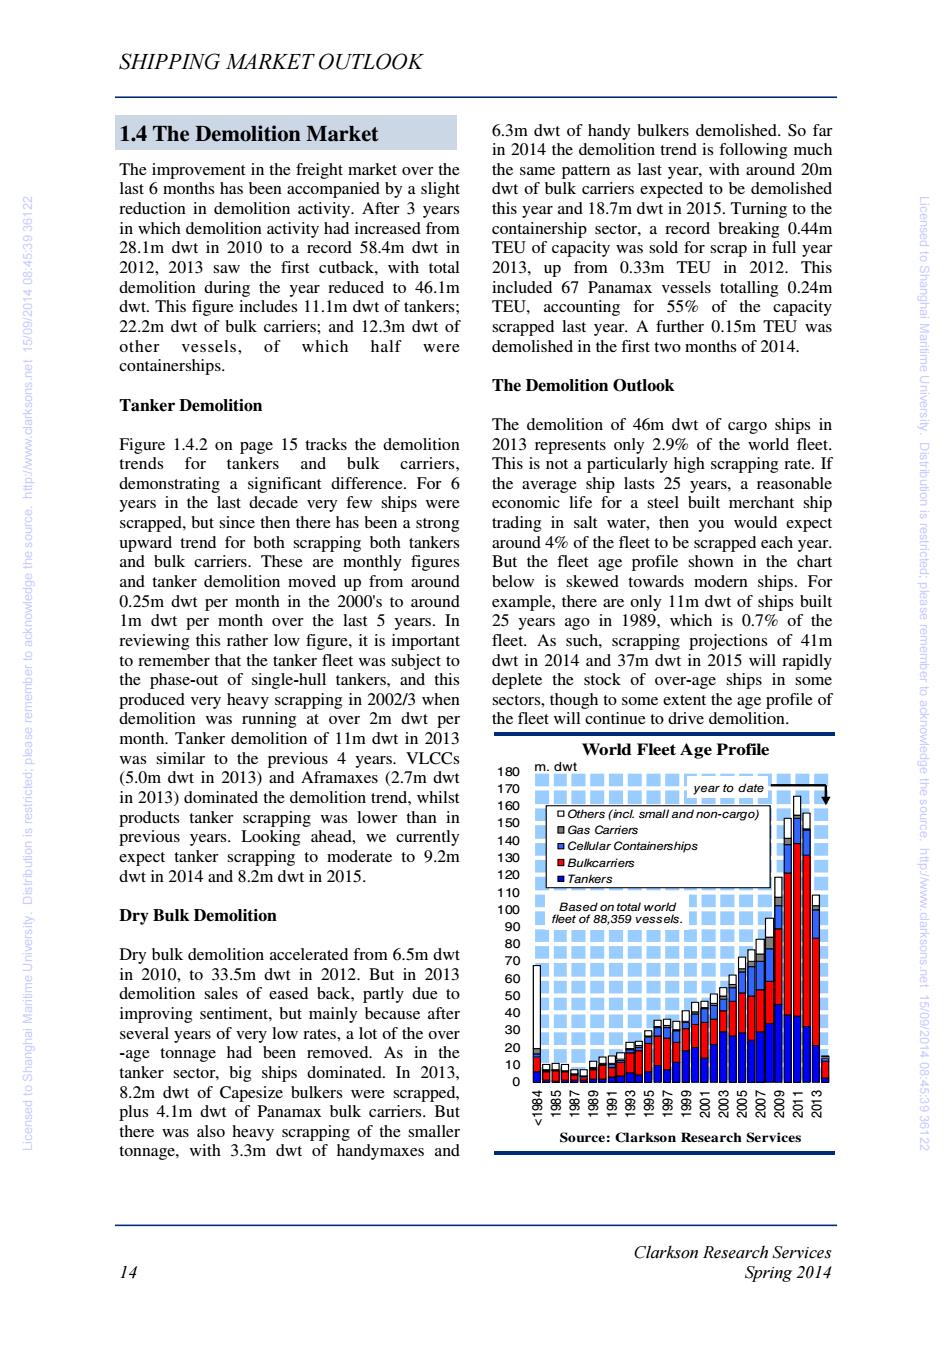
SHIPPING MARKET OUTLOOK 1.4 The Demolition Market 6.3m dwt of handy bulkers demolished.So far in 2014 the demolition trend is following much The improvement in the freight market over the the same pattern as last year,with around 20m last 6 months has been accompanied by a slight dwt of bulk carriers expected to be demolished 的 reduction in demolition activity.After 3 years this year and 18.7m dwt in 2015.Turning to the in which demolition activity had increased from containership sector,a record breaking 0.44m 28.1m dwt in 2010 to a record 58.4m dwt in TEU of capacity was sold for scrap in full year 2012,2013 saw the first cutback,with total 2013,up from 0.33m TEU in 2012.This demolition during the year reduced to 46.1m included 67 Panamax vessels totalling 0.24m Licensed to Shanghal #10216031 dwt.This figure includes 11.1m dwt of tankers; TEU,accounting for 55%of the capacity 22.2m dwt of bulk carriers;and 12.3m dwt of scrapped last year.A further 0.15m TEU was other vessels,of which half were demolished in the first two months of 2014. containerships. The Demolition Outlook Tanker Demolition The demolition of 46m dwt of cargo ships in Figure 1.4.2 on page 15 tracks the demolition 2013 represents only 2.9%of the world fleet. trends for tankers and bulk carriers, This is not a particularly high scrapping rate.If demonstrating a significant difference.For 6 the average ship lasts 25 years,a reasonable years in the last decade very few ships were economic life for a steel built merchant ship Dis tribution is scrapped,but since then there has been a strong trading in salt water,then you would expect upward trend for both scrapping both tankers around 4%of the fleet to be scrapped each year. and bulk carriers.These are monthly figures But the fleet age profile shown in the chart and tanker demolition moved up from around below is skewed towards modern ships.For 0.25m dwt per month in the 2000's to around example,there are only 11m dwt of ships built plea 1m dwt per month over the last 5 years.In 25 years ago in 1989,which is 0.7%of the reviewing this rather low figure,it is important fleet.As such,scrapping projections of 41m to remember that the tanker fleet was subject to dwt in 2014 and 37m dwt in 2015 will rapidly the phase-out of single-hull tankers,and this deplete the stock of over-age ships in some remember to produced very heavy scrapping in 2002/3 when sectors,though to some extent the age profile of demolition was running at over 2m dwt per the fleet will continue to drive demolition. month.Tanker demolition of 11m dwt in 2013 was similar to the previous 4 years.VLCCs World Fleet Age Profile (5.0m dwt in 2013)and Aframaxes(2.7m dwt 180 m dwt 170 in 2013)dominated the demolition trend,whilst year to date 160 products tanker scrapping was lower than in Others (incl.small and non-cargo) 150 previous years.Looking ahead,we currently 口Gas Carriers 140 Cellular Containerships expect tanker scrapping to moderate to 9.2m 130 Bulkcarriers dwt in 2014 and 8.2m dwt in 2015. 120 Tankers 110 Ba total Dry Bulk Demolition 100 leet of 88.359 vess 90 80 Dry bulk demolition accelerated from 6.5m dwt 70 in 2010,to 33.5m dwt in 2012.But in 2013 60 demolition sales of eased back,partly due to 50 improving sentiment,but mainly because after 40 several years of very low rates,a lot of the over 30 -age tonnage had been removed.As in the 20 10 acknowledge the source.http://www.clarksons.net 15/09/2014 08:45:3936122 tanker sector,big ships dominated.In 2013, 0 8.2m dwt of Capesize bulkers were scrapped, plus 4.1m dwt of Panamax bulk carriers.But 虽⑧显西虽虽⑧虽急食晨食晨点局 there was also heavy scrapping of the smaller Source:Clarkson Research Services tonnage,with 3.3m dwt of handymaxes and Clarkson Research Services 14 Spring 2014Clarkson Research Services 14 Spring 2014 SHIPPING MARKET OUTLOOK The improvement in the freight market over the last 6 months has been accompanied by a slight reduction in demolition activity. After 3 years in which demolition activity had increased from 28.1m dwt in 2010 to a record 58.4m dwt in 2012, 2013 saw the first cutback, with total demolition during the year reduced to 46.1m dwt. This figure includes 11.1m dwt of tankers; 22.2m dwt of bulk carriers; and 12.3m dwt of other vessels, of which half were containerships. Tanker Demolition Figure 1.4.2 on page 15 tracks the demolition trends for tankers and bulk carriers, demonstrating a significant difference. For 6 years in the last decade very few ships were scrapped, but since then there has been a strong upward trend for both scrapping both tankers and bulk carriers. These are monthly figures and tanker demolition moved up from around 0.25m dwt per month in the 2000's to around 1m dwt per month over the last 5 years. In reviewing this rather low figure, it is important to remember that the tanker fleet was subject to the phase-out of single-hull tankers, and this produced very heavy scrapping in 2002/3 when demolition was running at over 2m dwt per month. Tanker demolition of 11m dwt in 2013 was similar to the previous 4 years. VLCCs (5.0m dwt in 2013) and Aframaxes (2.7m dwt in 2013) dominated the demolition trend, whilst products tanker scrapping was lower than in previous years. Looking ahead, we currently expect tanker scrapping to moderate to 9.2m dwt in 2014 and 8.2m dwt in 2015. Dry Bulk Demolition Dry bulk demolition accelerated from 6.5m dwt in 2010, to 33.5m dwt in 2012. But in 2013 demolition sales of eased back, partly due to improving sentiment, but mainly because after several years of very low rates, a lot of the over -age tonnage had been removed. As in the tanker sector, big ships dominated. In 2013, 8.2m dwt of Capesize bulkers were scrapped, plus 4.1m dwt of Panamax bulk carriers. But there was also heavy scrapping of the smaller tonnage, with 3.3m dwt of handymaxes and 6.3m dwt of handy bulkers demolished. So far in 2014 the demolition trend is following much the same pattern as last year, with around 20m dwt of bulk carriers expected to be demolished this year and 18.7m dwt in 2015. Turning to the containership sector, a record breaking 0.44m TEU of capacity was sold for scrap in full year 2013, up from 0.33m TEU in 2012. This included 67 Panamax vessels totalling 0.24m TEU, accounting for 55% of the capacity scrapped last year. A further 0.15m TEU was demolished in the first two months of 2014. The Demolition Outlook The demolition of 46m dwt of cargo ships in 2013 represents only 2.9% of the world fleet. This is not a particularly high scrapping rate. If the average ship lasts 25 years, a reasonable economic life for a steel built merchant ship trading in salt water, then you would expect around 4% of the fleet to be scrapped each year. But the fleet age profile shown in the chart below is skewed towards modern ships. For example, there are only 11m dwt of ships built 25 years ago in 1989, which is 0.7% of the fleet. As such, scrapping projections of 41m dwt in 2014 and 37m dwt in 2015 will rapidly deplete the stock of over-age ships in some sectors, though to some extent the age profile of the fleet will continue to drive demolition. 1.4 The Demolition Market 0 10 20 30 40 50 60 70 80 90 100 110 120 130 140 150 160 170 180 <1984 1985 1987 1989 1991 1993 1995 1997 1999 2001 2003 2005 2007 2009 2011 2013 m. dwt Source: Clarkson Research Services World Fleet Age Profile Others (incl. small and non-cargo) Gas Carriers Cellular Containerships Bulkcarriers Tankers year to date Based on total world fleet of 88,359 vessels. Licensed to Shanghai Maritime University. Distribution is restricted; please remember to acknowledge the source. http://www.clarksons.net 15/09/2014 08:45:39 36122 Licensed to Shanghai Maritime University. Distribution is restricted; please remember to acknowledge the source. http://www.clarksons.net 15/09/2014 08:45:39 36122