正在加载图片...
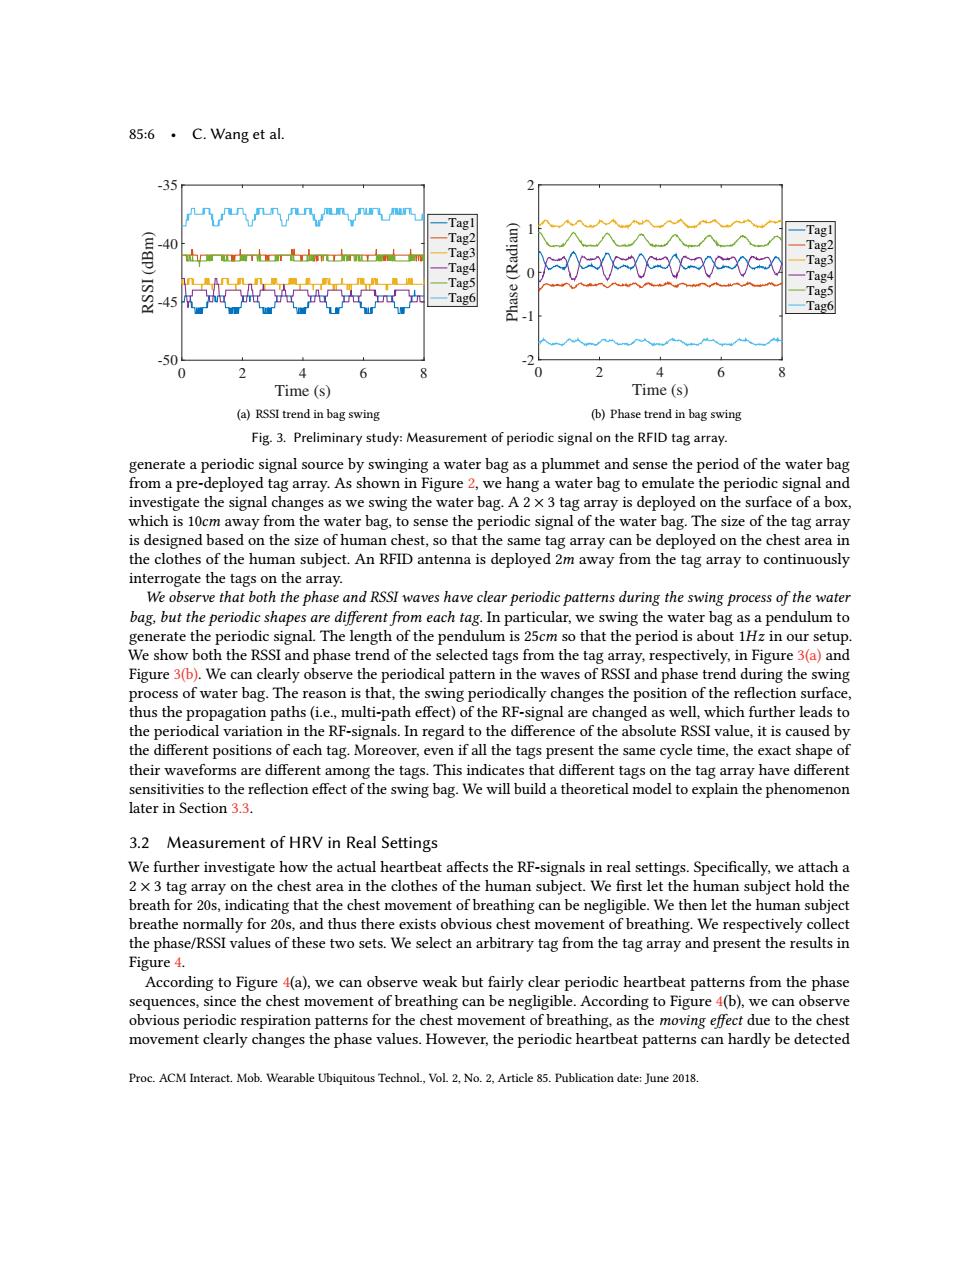
85:6·C.Wang et al. -35 -Tagl (ue!ped) -Tagl 40 Tag2 ap) Tag3 Tag2 Tag4 00a00Ga090a Tag3 Tag5 -Tag4 -47 Tag6 Tag5 Tag6 .50 2 4 6 2 6 Time (s) Time (s) (a)RSSI trend in bag swing (b)Phase trend in bag swing Fig.3.Preliminary study:Measurement of periodic signal on the RFID tag array. generate a periodic signal source by swinging a water bag as a plummet and sense the period of the water bag from a pre-deployed tag array.As shown in Figure 2,we hang a water bag to emulate the periodic signal and investigate the signal changes as we swing the water bag.A 2 x 3 tag array is deployed on the surface of a box, which is 10cm away from the water bag,to sense the periodic signal of the water bag.The size of the tag array is designed based on the size of human chest,so that the same tag array can be deployed on the chest area in the clothes of the human subject.An RFID antenna is deployed 2m away from the tag array to continuously interrogate the tags on the array. We observe that both the phase and RSSI waves have clear periodic patterns during the swing process of the water bag,but the periodic shapes are different from each tag.In particular,we swing the water bag as a pendulum to generate the periodic signal.The length of the pendulum is 25cm so that the period is about 1Hz in our setup. We show both the RSSI and phase trend of the selected tags from the tag array,respectively,in Figure 3(a)and Figure 3(b).We can clearly observe the periodical pattern in the waves of RSSI and phase trend during the swing process of water bag.The reason is that,the swing periodically changes the position of the reflection surface, thus the propagation paths(i.e.,multi-path effect)of the RF-signal are changed as well,which further leads to the periodical variation in the RF-signals.In regard to the difference of the absolute RSSI value,it is caused by the different positions of each tag.Moreover,even if all the tags present the same cycle time,the exact shape of their waveforms are different among the tags.This indicates that different tags on the tag array have different sensitivities to the reflection effect of the swing bag.We will build a theoretical model to explain the phenomenon later in Section 3.3. 3.2 Measurement of HRV in Real Settings We further investigate how the actual heartbeat affects the RF-signals in real settings.Specifically,we attach a 2 x 3 tag array on the chest area in the clothes of the human subject.We first let the human subject hold the breath for 20s,indicating that the chest movement of breathing can be negligible.We then let the human subject breathe normally for 20s,and thus there exists obvious chest movement of breathing.We respectively collect the phase/RSSI values of these two sets.We select an arbitrary tag from the tag array and present the results in Figure 4. According to Figure 4(a),we can observe weak but fairly clear periodic heartbeat patterns from the phase sequences,since the chest movement of breathing can be negligible.According to Figure 4(b),we can observe obvious periodic respiration patterns for the chest movement of breathing,as the moving effect due to the chest movement clearly changes the phase values.However,the periodic heartbeat patterns can hardly be detected Proc.ACM Interact.Mob.Wearable Ubiquitous Technol,Vol.2,No.2,Article 85.Publication date:June 2018.85:6 • C. Wang et al. Time (s) 0 2 4 6 8 RSSI (dBm) -50 -45 -40 -35 Tag1 Tag2 Tag3 Tag4 Tag5 Tag6 (a) RSSI trend in bag swing Time (s) 0 2 4 6 8 Phase (Radian) -2 -1 0 1 2 Tag1 Tag2 Tag3 Tag4 Tag5 Tag6 (b) Phase trend in bag swing Fig. 3. Preliminary study: Measurement of periodic signal on the RFID tag array. generate a periodic signal source by swinging a water bag as a plummet and sense the period of the water bag from a pre-deployed tag array. As shown in Figure 2, we hang a water bag to emulate the periodic signal and investigate the signal changes as we swing the water bag. A 2 × 3 tag array is deployed on the surface of a box, which is 10cm away from the water bag, to sense the periodic signal of the water bag. The size of the tag array is designed based on the size of human chest, so that the same tag array can be deployed on the chest area in the clothes of the human subject. An RFID antenna is deployed 2m away from the tag array to continuously interrogate the tags on the array. We observe that both the phase and RSSI waves have clear periodic patterns during the swing process of the water bag, but the periodic shapes are different from each tag. In particular, we swing the water bag as a pendulum to generate the periodic signal. The length of the pendulum is 25cm so that the period is about 1Hz in our setup. We show both the RSSI and phase trend of the selected tags from the tag array, respectively, in Figure 3(a) and Figure 3(b). We can clearly observe the periodical pattern in the waves of RSSI and phase trend during the swing process of water bag. The reason is that, the swing periodically changes the position of the reflection surface, thus the propagation paths (i.e., multi-path effect) of the RF-signal are changed as well, which further leads to the periodical variation in the RF-signals. In regard to the difference of the absolute RSSI value, it is caused by the different positions of each tag. Moreover, even if all the tags present the same cycle time, the exact shape of their waveforms are different among the tags. This indicates that different tags on the tag array have different sensitivities to the reflection effect of the swing bag. We will build a theoretical model to explain the phenomenon later in Section 3.3. 3.2 Measurement of HRV in Real Settings We further investigate how the actual heartbeat affects the RF-signals in real settings. Specifically, we attach a 2 × 3 tag array on the chest area in the clothes of the human subject. We first let the human subject hold the breath for 20s, indicating that the chest movement of breathing can be negligible. We then let the human subject breathe normally for 20s, and thus there exists obvious chest movement of breathing. We respectively collect the phase/RSSI values of these two sets. We select an arbitrary tag from the tag array and present the results in Figure 4. According to Figure 4(a), we can observe weak but fairly clear periodic heartbeat patterns from the phase sequences, since the chest movement of breathing can be negligible. According to Figure 4(b), we can observe obvious periodic respiration patterns for the chest movement of breathing, as the moving effect due to the chest movement clearly changes the phase values. However, the periodic heartbeat patterns can hardly be detected Proc. ACM Interact. Mob. Wearable Ubiquitous Technol., Vol. 2, No. 2, Article 85. Publication date: June 2018