正在加载图片...
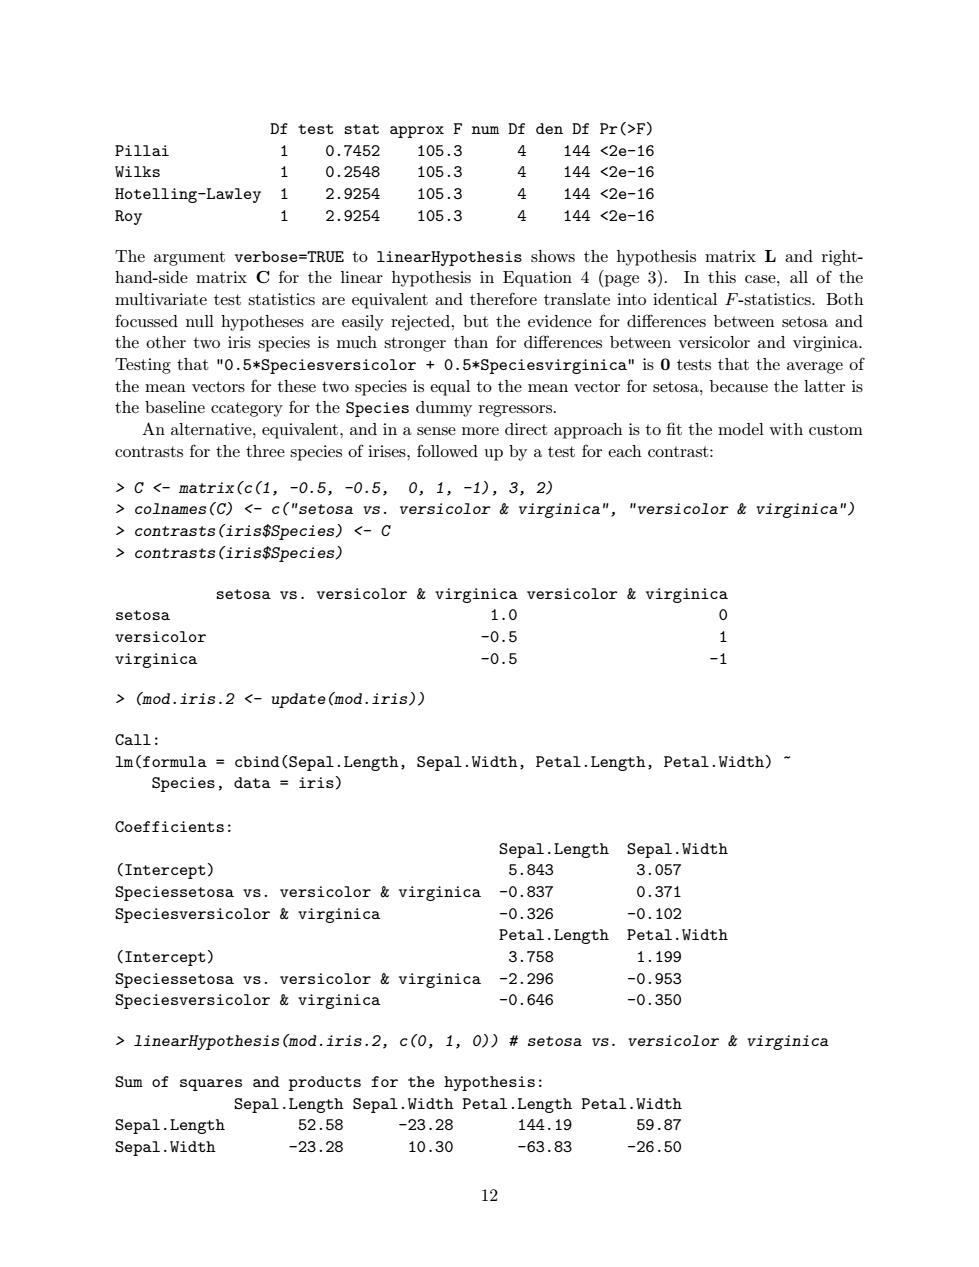
Df test stat approx F num Df den Df Pr(>F) Pillai 1 0.7452 105.3 4 144<2e-16 Wilks 1 0.2548 105.3 4 144<2e-16 Hotelling-Lawley 1 2.9254 105.3 4 144<2e-16 Roy 1 2.9254 105.3 4 144<2e-16 The argument verbose=TRUE to linearHypothesis shows the hypothesis matrix L and right- hand-side matrix C for the linear hypothesis in Equation 4(page 3).In this case,all of the multivariate test statistics are equivalent and therefore translate into identical F-statistics.Both focussed null hypotheses are easily rejected,but the evidence for differences between setosa and the other two iris species is much stronger than for differences between versicolor and virginica. Testing that "0.5*Speciesversicolor +0.5*Speciesvirginica"is 0 tests that the average of the mean vectors for these two species is equal to the mean vector for setosa,because the latter is the baseline ccategory for the Species dummy regressors. An alternative,equivalent,and in a sense more direct approach is to fit the model with custom contrasts for the three species of irises,followed up by a test for each contrast: >C<-matrix(c(1,-0.5,-0.5,0,1,-1),3,2) colnames(C)<-c("setosa vs.versicolor virginica","versicolor virginica") contrasts(iris$Species)<-C contrasts(iris$Species) setosa vs.versicolor virginica versicolor&virginica setosa 1.0 0 versicolor -0.5 1 virginica -0.5 -1 (mod.iris.2 <-update(mod.iris)) Call: 1m(formula cbind(Sepal.Length,Sepal.Width,Petal.Length,Petal.Width) Species,data iris) Coefficients: Sepal.Length Sepal.Width (Intercept) 5.843 3.057 Speciessetosa vs.versicolor virginica -0.837 0.371 Speciesversicolor&virginica -0.326 -0.102 Petal.Length Petal.Width (Intercept) 3.758 1.199 Speciessetosa vs.versicolor virginica -2.296 -0.953 Speciesversicolor&virginica -0.646 -0.350 linearHypothesis(mod.iris.2,c(0,1,0))#setosa vs.versicolor virginica Sum of squares and products for the hypothesis: Sepal.Length Sepal.Width Petal.Length Petal.Width Sepal.Length 52.58 -23.28 144.19 59.87 Sepal.Width -23.28 10.30 -63.83 -26.50 12Df test stat approx F num Df den Df Pr(>F) Pillai 1 0.7452 105.3 4 144 <2e-16 Wilks 1 0.2548 105.3 4 144 <2e-16 Hotelling-Lawley 1 2.9254 105.3 4 144 <2e-16 Roy 1 2.9254 105.3 4 144 <2e-16 The argument verbose=TRUE to linearHypothesis shows the hypothesis matrix L and righthand-side matrix C for the linear hypothesis in Equation 4 (page 3). In this case, all of the multivariate test statistics are equivalent and therefore translate into identical F-statistics. Both focussed null hypotheses are easily rejected, but the evidence for differences between setosa and the other two iris species is much stronger than for differences between versicolor and virginica. Testing that "0.5*Speciesversicolor + 0.5*Speciesvirginica" is 0 tests that the average of the mean vectors for these two species is equal to the mean vector for setosa, because the latter is the baseline ccategory for the Species dummy regressors. An alternative, equivalent, and in a sense more direct approach is to fit the model with custom contrasts for the three species of irises, followed up by a test for each contrast: > C <- matrix(c(1, -0.5, -0.5, 0, 1, -1), 3, 2) > colnames(C) <- c("setosa vs. versicolor & virginica", "versicolor & virginica") > contrasts(iris$Species) <- C > contrasts(iris$Species) setosa vs. versicolor & virginica versicolor & virginica setosa 1.0 0 versicolor -0.5 1 virginica -0.5 -1 > (mod.iris.2 <- update(mod.iris)) Call: lm(formula = cbind(Sepal.Length, Sepal.Width, Petal.Length, Petal.Width) ~ Species, data = iris) Coefficients: Sepal.Length Sepal.Width (Intercept) 5.843 3.057 Speciessetosa vs. versicolor & virginica -0.837 0.371 Speciesversicolor & virginica -0.326 -0.102 Petal.Length Petal.Width (Intercept) 3.758 1.199 Speciessetosa vs. versicolor & virginica -2.296 -0.953 Speciesversicolor & virginica -0.646 -0.350 > linearHypothesis(mod.iris.2, c(0, 1, 0)) # setosa vs. versicolor & virginica Sum of squares and products for the hypothesis: Sepal.Length Sepal.Width Petal.Length Petal.Width Sepal.Length 52.58 -23.28 144.19 59.87 Sepal.Width -23.28 10.30 -63.83 -26.50 12