正在加载图片...
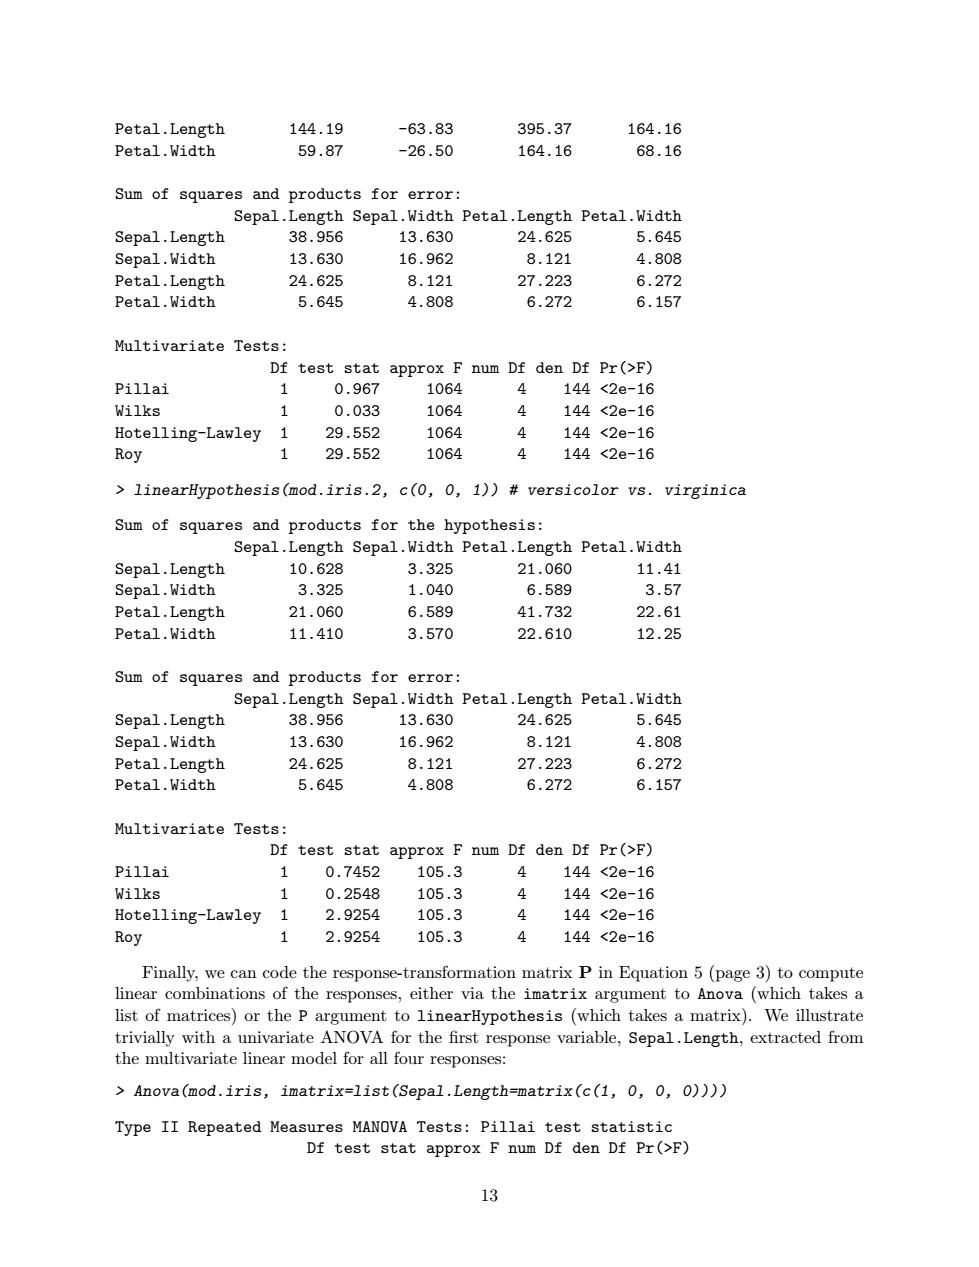
Petal.Length 144.19 -63.83 395.37 164.16 Petal.Width 59.87 -26.50 164.16 68.16 Sum of squares and products for error: Sepal.Length Sepal.Width Petal.Length Petal.Width Sepal.Length 38.956 13.630 24.625 5.645 Sepal.Width 13.630 16.962 8.121 4.808 Petal.Length 24.625 8.121 27.223 6.272 Petal.Width 5.645 4.808 6.272 6.157 Multivariate Tests: Df test stat approx F num Df den Df Pr(>F) Pillai 1 0.967 1064 4 144<2e-16 Wilks 1 0.033 1064 4 144<2e-16 Hotelling-Lawley 29.552 1064 144<2e-16 Roy 29.552 1064 144<2e-16 >linearHypothesis(mod.iris.2,c(0,0,1))#versicolor vs. virginica Sum of squares and products for the hypothesis: Sepal.Length Sepal.Width Petal.Length Petal.Width Sepal.Length 10.628 3.325 21.060 11.41 Sepal.Width 3.325 1.040 6.589 3.57 Petal.Length 21.060 6.589 41.732 22.61 Petal.Width 11.410 3.570 22.610 12.25 Sum of squares and products for error: Sepal.Length Sepal.Width Petal.Length Petal.Width Sepal.Length 38.956 13.630 24.625 5.645 Sepal.Width 13.630 16.962 8.121 4.808 Petal.Length 24.625 8.121 27.223 6.272 Petal.Width 5.645 4.808 6.272 6.157 Multivariate Tests: Df test stat approx F num Df den Df Pr(>F) Pillai 0.7452 105.3 144<2e-16 Wilks 1 0.2548 105.3 144<2e-16 Hotelling-Lawley 1 2.9254 105.3 144<2e-16 Roy 1 2.9254 105.3 144<2e-16 Finally,we can code the response-transformation matrix P in Equation 5(page 3)to compute linear combinations of the responses,either via the imatrix argument to Anova (which takes a list of matrices)or the P argument to linearHypothesis(which takes a matrix).We illustrate trivially with a univariate ANOVA for the first response variable,Sepal.Length,extracted from the multivariate linear model for all four responses: Anova(mod.iris,imatrix=list(Sepal.Length=matrix(c(1,0,0,0)))) Type II Repeated Measures MANOVA Tests:Pillai test statistic Df test stat approx F num Df den Df Pr(>F) 13Petal.Length 144.19 -63.83 395.37 164.16 Petal.Width 59.87 -26.50 164.16 68.16 Sum of squares and products for error: Sepal.Length Sepal.Width Petal.Length Petal.Width Sepal.Length 38.956 13.630 24.625 5.645 Sepal.Width 13.630 16.962 8.121 4.808 Petal.Length 24.625 8.121 27.223 6.272 Petal.Width 5.645 4.808 6.272 6.157 Multivariate Tests: Df test stat approx F num Df den Df Pr(>F) Pillai 1 0.967 1064 4 144 <2e-16 Wilks 1 0.033 1064 4 144 <2e-16 Hotelling-Lawley 1 29.552 1064 4 144 <2e-16 Roy 1 29.552 1064 4 144 <2e-16 > linearHypothesis(mod.iris.2, c(0, 0, 1)) # versicolor vs. virginica Sum of squares and products for the hypothesis: Sepal.Length Sepal.Width Petal.Length Petal.Width Sepal.Length 10.628 3.325 21.060 11.41 Sepal.Width 3.325 1.040 6.589 3.57 Petal.Length 21.060 6.589 41.732 22.61 Petal.Width 11.410 3.570 22.610 12.25 Sum of squares and products for error: Sepal.Length Sepal.Width Petal.Length Petal.Width Sepal.Length 38.956 13.630 24.625 5.645 Sepal.Width 13.630 16.962 8.121 4.808 Petal.Length 24.625 8.121 27.223 6.272 Petal.Width 5.645 4.808 6.272 6.157 Multivariate Tests: Df test stat approx F num Df den Df Pr(>F) Pillai 1 0.7452 105.3 4 144 <2e-16 Wilks 1 0.2548 105.3 4 144 <2e-16 Hotelling-Lawley 1 2.9254 105.3 4 144 <2e-16 Roy 1 2.9254 105.3 4 144 <2e-16 Finally, we can code the response-transformation matrix P in Equation 5 (page 3) to compute linear combinations of the responses, either via the imatrix argument to Anova (which takes a list of matrices) or the P argument to linearHypothesis (which takes a matrix). We illustrate trivially with a univariate ANOVA for the first response variable, Sepal.Length, extracted from the multivariate linear model for all four responses: > Anova(mod.iris, imatrix=list(Sepal.Length=matrix(c(1, 0, 0, 0)))) Type II Repeated Measures MANOVA Tests: Pillai test statistic Df test stat approx F num Df den Df Pr(>F) 13