正在加载图片...
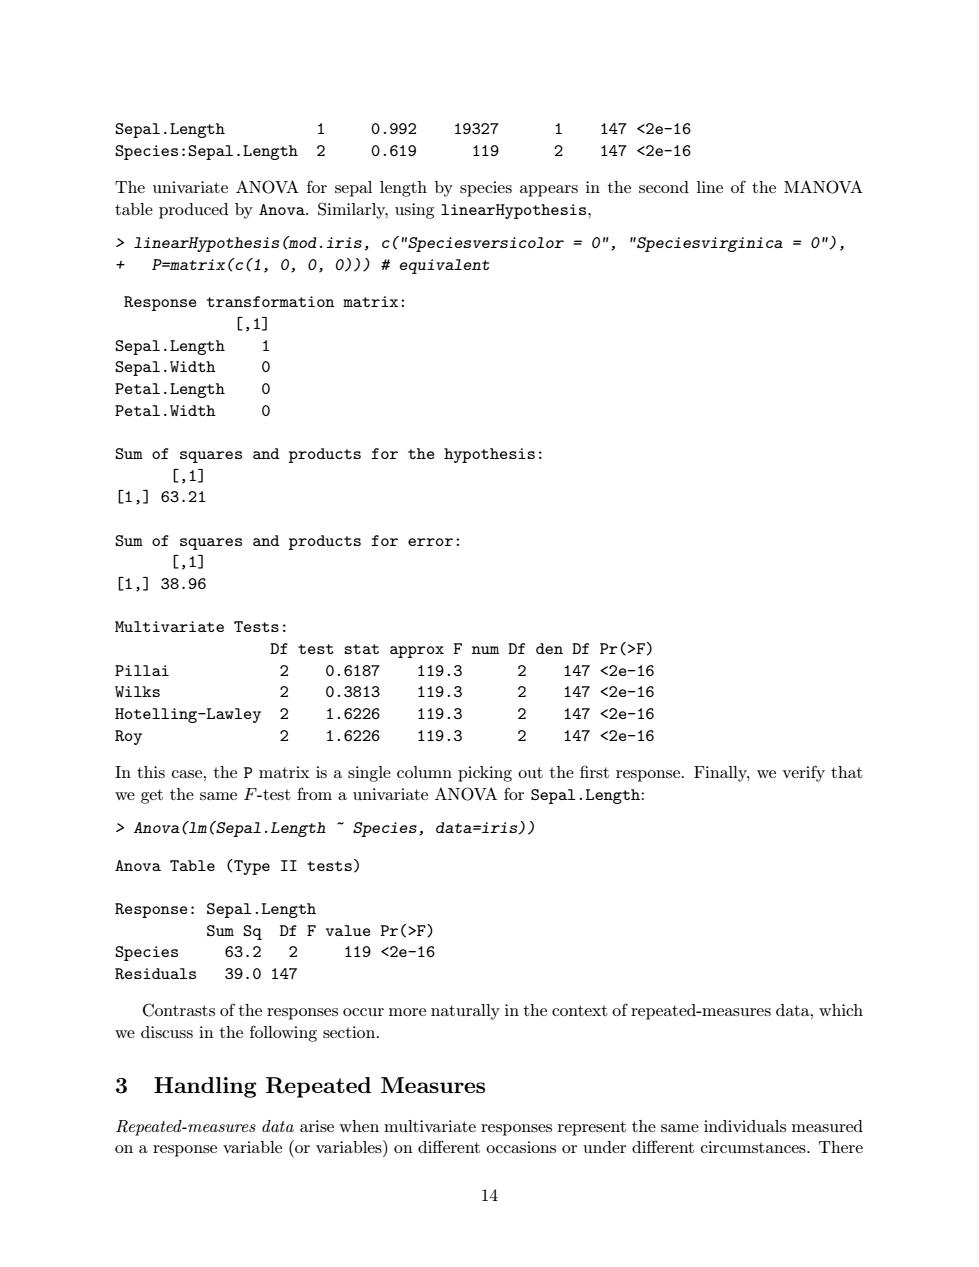
Sepal.Length 1 0.992 19327 1 147<2e-16 Species:Sepal.Length 2 0.619 119 2 147<2e-16 The univariate ANOVA for sepal length by species appears in the second line of the MANOVA table produced by Anova.Similarly,using linearHypothesis, linearHypothesis(mod.iris,c("Speciesversicolor =0","Speciesvirginica =0"), P=matrix(c(1,0,0,0)))#equivalent Response transformation matrix: [,1] Sepal.Length 1 Sepal.Width 0 Petal.Length 0 Petal.Width 0 Sum of squares and products for the hypothesis: [,1] [1,]63.21 Sum of squares and products for error: [,1] [1,]38.96 Multivariate Tests: Df test stat approx F num Df den Df Pr(>F) Pillai 2 0.6187 119.3 x 147<2e-16 Wilks 2 0.3813 119.3 2 147<2e-16 Hotelling-Lawley 2 1.6226 119.3 3 147<2e-16 Roy 2 1.6226 119.3 147<2e-16 In this case,the P matrix is a single column picking out the first response.Finally,we verify that we get the same F-test from a univariate ANOVA for Sepal.Length: Anova(lm(Sepal.Length ~Species,data=iris)) Anova Table (Type II tests) Response:Sepal.Length Sum Sq Df F value Pr(>F) Species 63.22 119<2e-16 Residuals 39.0147 Contrasts of the responses occur more naturally in the context of repeated-measures data,which we discuss in the following section. 3 Handling Repeated Measures Repeated-measures data arise when multivariate responses represent the same individuals measured on a response variable (or variables)on different occasions or under different circumstances.There 14Sepal.Length 1 0.992 19327 1 147 <2e-16 Species:Sepal.Length 2 0.619 119 2 147 <2e-16 The univariate ANOVA for sepal length by species appears in the second line of the MANOVA table produced by Anova. Similarly, using linearHypothesis, > linearHypothesis(mod.iris, c("Speciesversicolor = 0", "Speciesvirginica = 0"), + P=matrix(c(1, 0, 0, 0))) # equivalent Response transformation matrix: [,1] Sepal.Length 1 Sepal.Width 0 Petal.Length 0 Petal.Width 0 Sum of squares and products for the hypothesis: [,1] [1,] 63.21 Sum of squares and products for error: [,1] [1,] 38.96 Multivariate Tests: Df test stat approx F num Df den Df Pr(>F) Pillai 2 0.6187 119.3 2 147 <2e-16 Wilks 2 0.3813 119.3 2 147 <2e-16 Hotelling-Lawley 2 1.6226 119.3 2 147 <2e-16 Roy 2 1.6226 119.3 2 147 <2e-16 In this case, the P matrix is a single column picking out the first response. Finally, we verify that we get the same F-test from a univariate ANOVA for Sepal.Length: > Anova(lm(Sepal.Length ~ Species, data=iris)) Anova Table (Type II tests) Response: Sepal.Length Sum Sq Df F value Pr(>F) Species 63.2 2 119 <2e-16 Residuals 39.0 147 Contrasts of the responses occur more naturally in the context of repeated-measures data, which we discuss in the following section. 3 Handling Repeated Measures Repeated-measures data arise when multivariate responses represent the same individuals measured on a response variable (or variables) on different occasions or under different circumstances. There 14