正在加载图片...
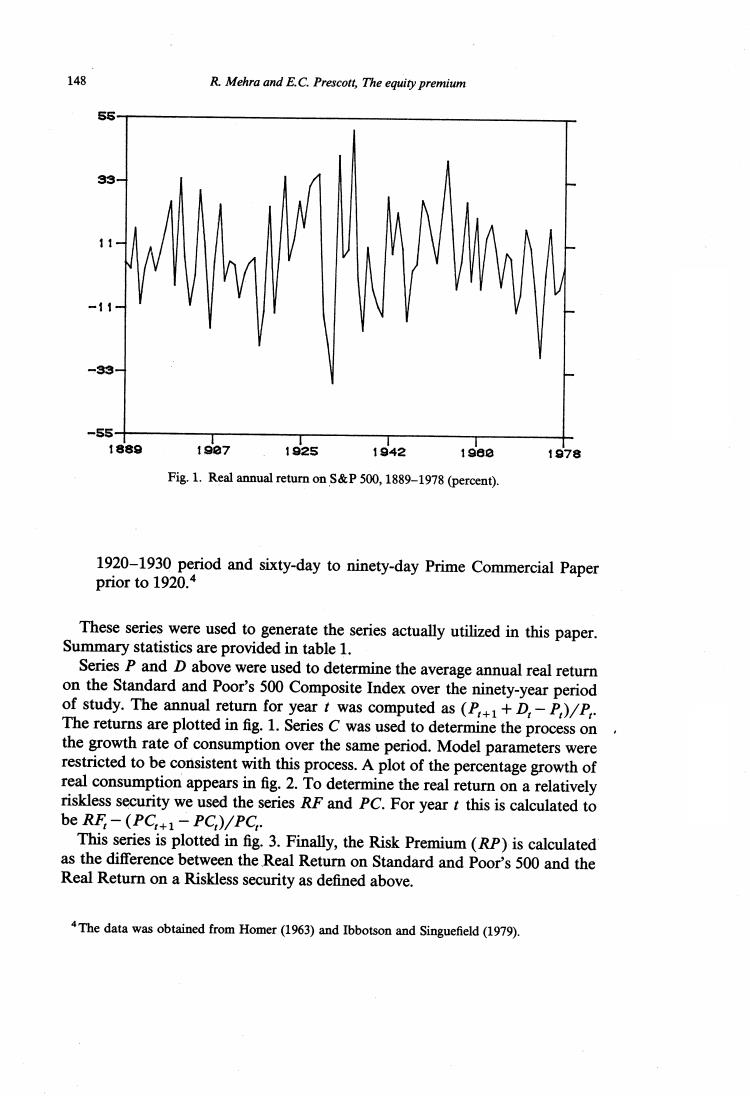
148 R.Mehra and E.C.Prescott,The equity premium -33 -55- 1889 19e7 1925 1942 1980 1978 Fig.1.Real annual return on S&P 500,1889-1978(percent). 1920-1930 period and sixty-day to ninety-day Prime Commercial Paper prior to 1920.4 These series were used to generate the series actually utilized in this paper. Summary statistics are provided in table 1. Series P and D above were used to determine the average annual real return on the Standard and Poor's 500 Composite Index over the ninety-year period of study.The annual return for year t was computed as (P++D,-P,)/P The returns are plotted in fig.1.Series C was used to determine the process on the growth rate of consumption over the same period.Model parameters were restricted to be consistent with this process.A plot of the percentage growth of real consumption appears in fig.2.To determine the real return on a relatively riskless security we used the series RF and PC.For year t this is calculated to be RF:-(PC:+1-PC,)/PC This series is plotted in fig.3.Finally,the Risk Premium(RP)is calculated as the difference between the Real Return on Standard and Poor's 500 and the Real Return on a Riskless security as defined above. 4The data was obtained from Homer(1963)and Ibbotson and Singuefield(1979)