正在加载图片...
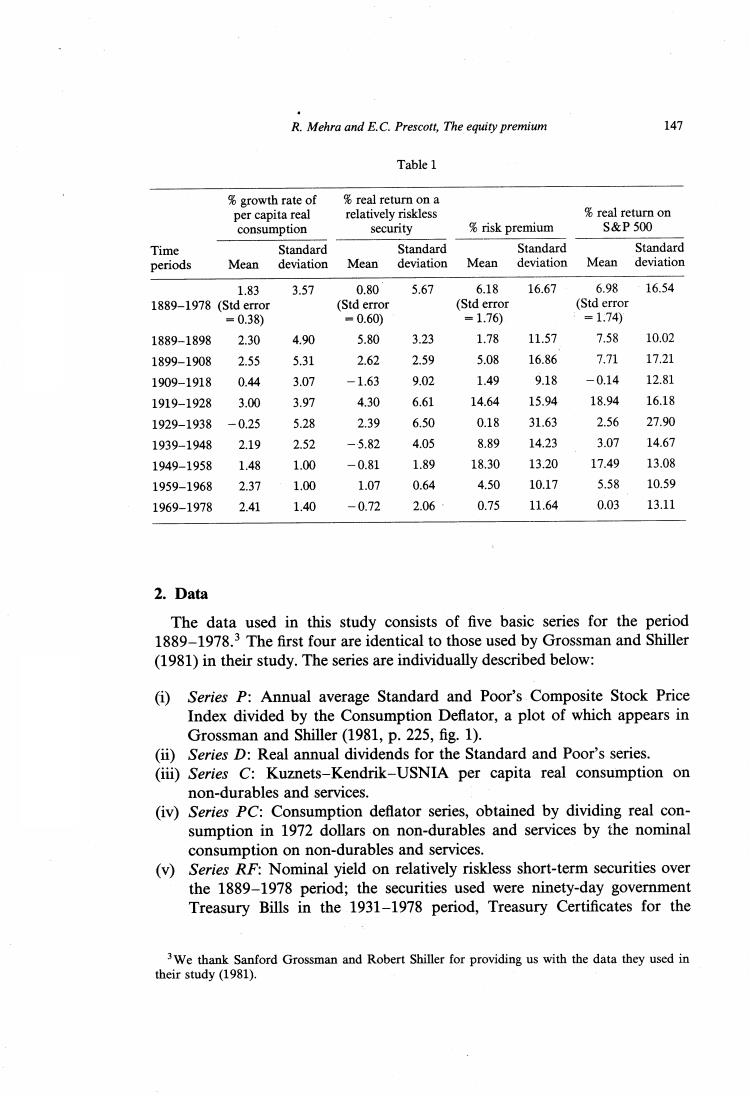
R.Mehra and E.C.Prescott,The equity premium 147 Table 1 %growth rate of real return on a per capita real relatively riskless real return on consumption security %risk premium S&P500 Time Standard Standard Standard Standard periods Mean deviation Mean deviation Mean deviation Mean deviation 1.83 3.57 0.80 5.67 6.18 16.67 6.98 16.54 1889-1978 (Std error (Std error (Std error (Std error =0.38) =0.60) =1.76) =1.74) 1889-1898 2.30 4.90 5.80 3.23 1.78 11.57 7.58 10.02 1899-1908 2.55 5.31 2.62 2.59 5.08 16.86 7.71 17.21 1909-1918 0.44 3.07 -1.63 9.02 1.49 9.18 -0.14 12.81 1919-1928 3.00 3.97 4.30 6.61 14.64 15.94 18.94 16.18 1929-1938 -0.25 5.28 2.39 6.50 0.18 31.63 2.56 27.90 1939-1948 2.19 2.52 -5.82 4.05 8.89 14.23 3.07 14.67 1949-1958 1.48 1.00 -0.81 1.89 18.30 13.20 17.49 13.08 1959-1968 2.37 1.00 1.07 0.64 4.50 10.17 5.58 10.59 1969-1978 2.41 1.40 -0.72 2.06 0.75 11.64 0.03 13.11 2.Data The data used in this study consists of five basic series for the period 1889-1978.3 The first four are identical to those used by Grossman and Shiller (1981)in their study.The series are individually described below: (i)Series P:Annual average Standard and Poor's Composite Stock Price Index divided by the Consumption Deflator,a plot of which appears in Grossman and Shiller(1981,p.225,fig.1). (ii)Series D:Real annual dividends for the Standard and Poor's series. (ii)Series C:Kuznets-Kendrik-USNIA per capita real consumption on non-durables and services. (iv)Series PC:Consumption deflator series,obtained by dividing real con- sumption in 1972 dollars on non-durables and services by the nominal consumption on non-durables and services. (v)Series RF:Nominal yield on relatively riskless short-term securities over the 1889-1978 period;the securities used were ninety-day government Treasury Bills in the 1931-1978 period,Treasury Certificates for the 3We thank Sanford Grossman and Robert Shiller for providing us with the data they used in their study (1981)