正在加载图片...
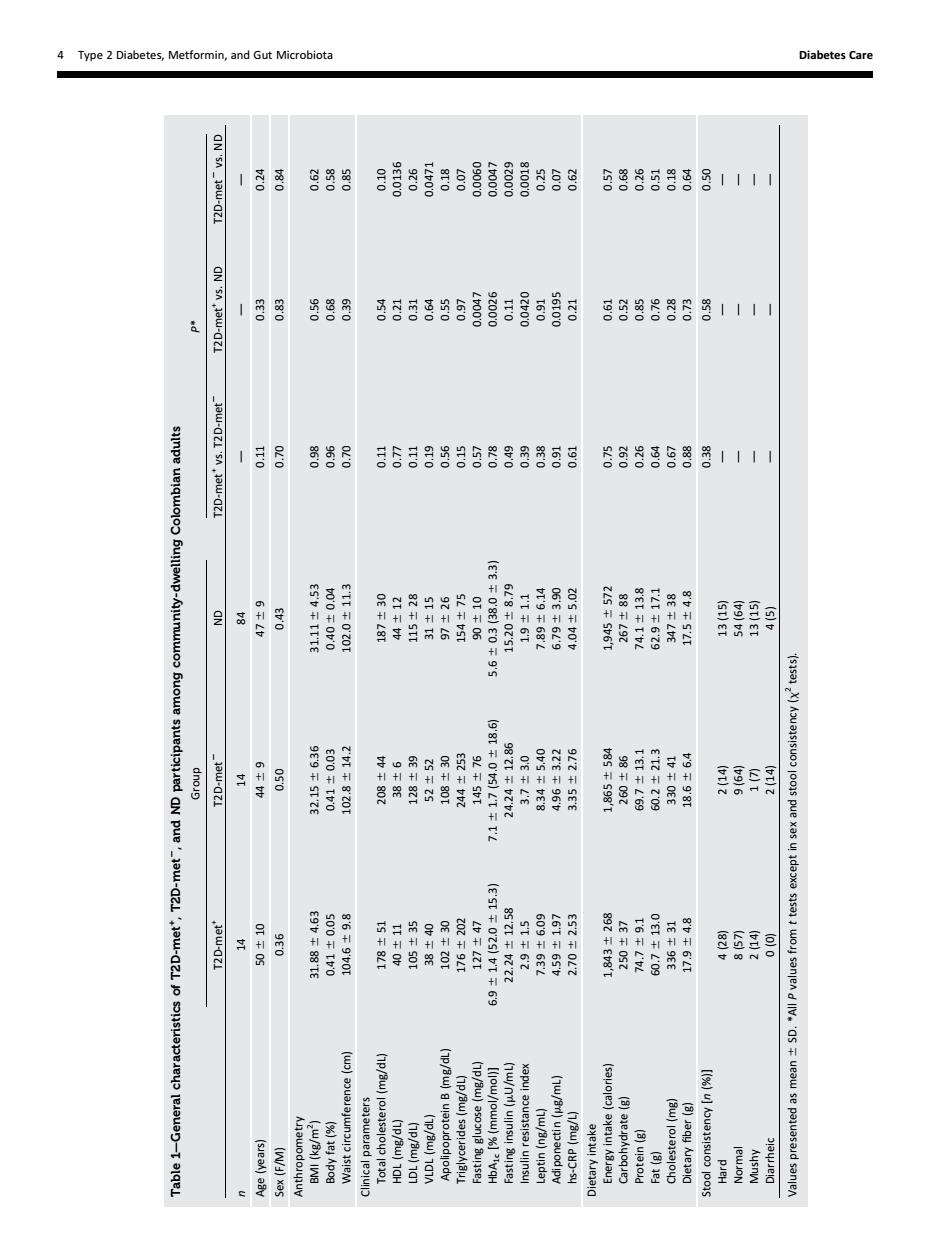
4 Type 2 Diabetes,Metformin,and Gut Microbiota Diabetes Care 18g8 8昌888838昌888 3日888B言昌君目8昌日 西始器然路1111 用Eea 888器111 日g 合器器阳9 woy sanjeA d llV.'OS ueaw se pal Table 1 —General characteristics of T2D-met+, T2D-met2, and ND participants among community-dwelling Colombian adults Group P* T2D-met+ T2D-met2 ND T2D-met+ vs. T2D-met2 T2D-met+ vs. ND T2D-met2 vs. ND n 14 14 84 d dd Age (years) 50 6 10 44 6 9 47 6 9 0.11 0.33 0.24 Sex (F/M) 0.36 0.50 0.43 0.70 0.83 0.84 Anthropometry BMI (kg/m2 ) 31.88 6 4.63 32.15 6 6.36 31.11 6 4.53 0.98 0.56 0.62 Body fat (%) 0.41 6 0.05 0.41 6 0.03 0.40 6 0.04 0.96 0.68 0.58 Waist circumference (cm) 104.6 6 9.8 102.8 6 14.2 102.0 6 11.3 0.70 0.39 0.85 Clinical parameters Total cholesterol (mg/dL) 178 6 51 208 6 44 187 6 30 0.11 0.54 0.10 HDL (mg/dL) 40 6 11 38 6 6 44 6 12 0.77 0.21 0.0136 LDL (mg/dL) 105 6 35 128 6 39 115 6 28 0.11 0.31 0.26 VLDL (mg/dL) 38 6 40 52 6 52 31 6 15 0.19 0.64 0.0471 Apolipoprotein B (mg/dL) 102 6 30 108 6 30 97 6 26 0.56 0.55 0.18 Triglycerides (mg/dL) 176 6 202 244 6 253 154 6 75 0.15 0.97 0.07 Fasting glucose (mg/dL) 127 6 47 145 6 76 90 6 10 0.57 0.0047 0.0060 HbA1c [% (mmol/mol)] 6.9 6 1.4 (52.0 6 15.3) 7.1 6 1.7 (54.0 6 18.6) 5.6 6 0.3 (38.0 6 3.3) 0.78 0.0026 0.0047 Fasting insulin (mU/mL) 22.24 6 12.58 24.24 6 12.86 15.20 6 8.79 0.49 0.11 0.0029 Insulin resistance index 2.9 6 1.5 3.7 6 3.0 1.9 6 1.1 0.39 0.0420 0.0018 Leptin (ng/mL) 7.39 6 6.09 8.34 6 5.40 7.89 6 6.14 0.38 0.91 0.25 Adiponectin (mg/mL) 4.59 6 1.97 4.96 6 3.22 6.79 6 3.90 0.91 0.0195 0.07 hs-CRP (mg/L) 2.70 6 2.53 3.35 6 2.76 4.04 6 5.02 0.61 0.21 0.62 Dietary intake Energy intake (calories) 1,843 6 268 1,865 6 584 1,945 6 572 0.75 0.61 0.57 Carbohydrate (g) 250 6 37 260 6 86 267 6 88 0.92 0.52 0.68 Protein (g) 74.7 6 9.1 69.7 6 13.1 74.1 6 13.8 0.26 0.85 0.26 Fat (g) 60.7 6 13.0 60.2 6 21.3 62.9 6 17.1 0.64 0.76 0.51 Cholesterol (mg) 336 6 31 330 6 41 347 6 38 0.67 0.28 0.18 Dietary fiber (g) 17.9 6 4.8 18.6 6 6.4 17.5 6 4.8 0.88 0.73 0.64 Stool consistency [n (%)] 0.38 0.58 0.50 Hard 4 (28) 2 (14) 13 (15) d d d Normal 8 (57) 9 (64) 54 (64) d dd Mushy 2 (14) 1 (7) 13 (15) d dd Diarrheic 0 (0) 2 (14) 4 (5) d dd Values presented as mean 6 SD. *All P values from t tests except in sex and stool consistency (x2 tests). 4 Type 2 Diabetes, Metformin, and Gut Microbiota Diabetes Care