正在加载图片...
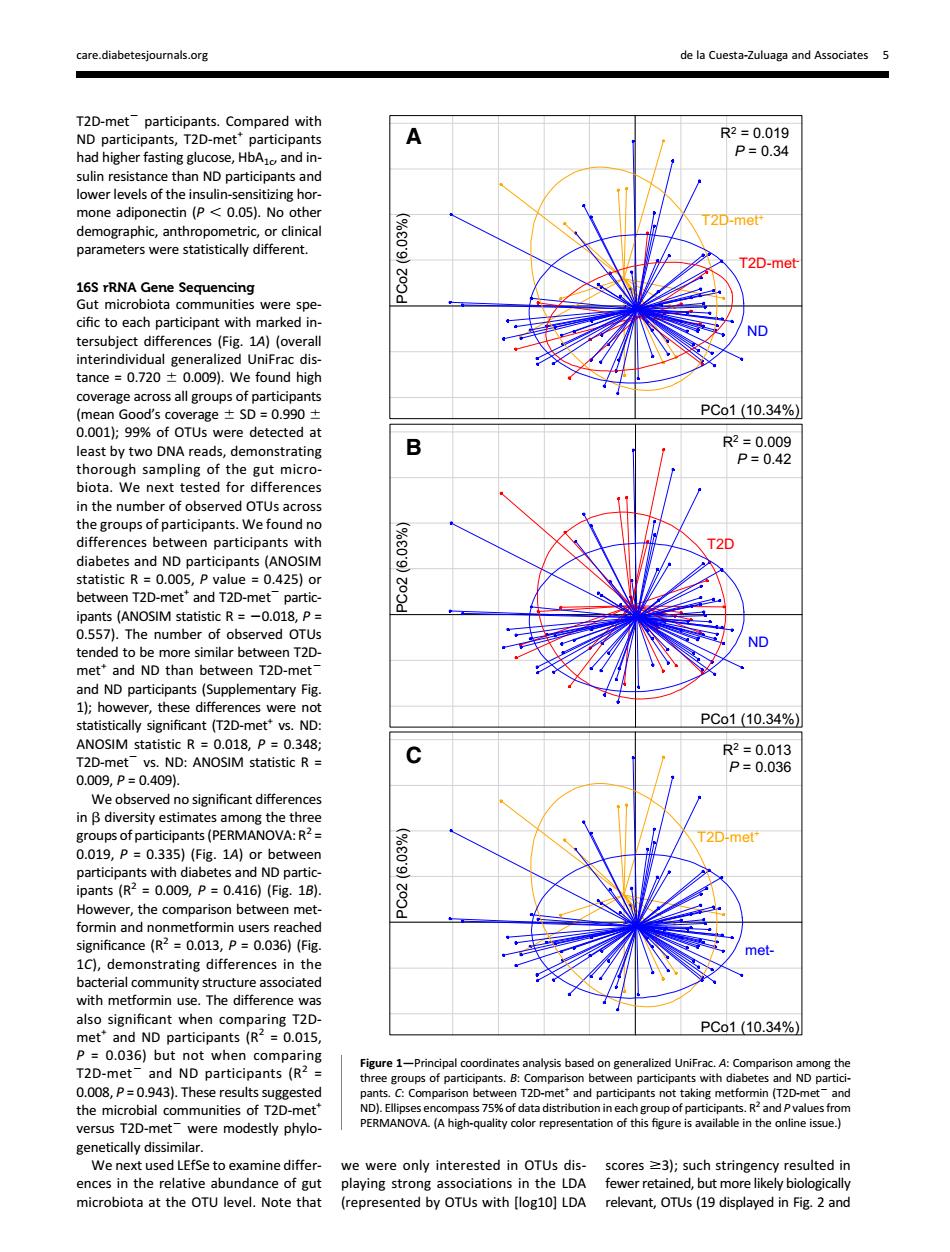
care.diabetesjo nals.org de la Cuesta-Zuluaga and Associates 5 T2D R2=0019 had higher fasting glucose,HbAand in- p=0.34 rent T20 16S rRNA Gene Sequencing e ND 009 g (mean Good's cov e±5D=09901 PCo1(10.34% 0.001);9%of OTUs were detected at ast bych biota.We next tested for ween participants with 20 diabetes and ND participants(A OSIM 2519 ipants (ANOSIM statistic R=-0.018,P= 0.557 The numbe of obse ved O met"and ND than bet n T2D-met (Supplementary Fig ce- PCo1(10.34% ANOSIM statistic R=0.018,P=0.348; :ANOSIM statistic R- We c s (PE 2D-me A) with dia nd ND partic =0.009,P=0.416)(Fg18) ever,the com significance (R2=0.013,P=0.036)(Fig. C).the PCo1(10.34%) De0036 0.01 T2D-met ND Participants (R 0.008,P=0.9 43).These results suggested and partici s not takir D the -me (T t-and VA.(A high-quality color represe e in the onine issue.) We next use to examine microbiota at the OTU level.Note that (represented by OTUs with [og10]LDA relevant.OTUs (19 displayed in Fig.2 andT2D-met2 participants. Compared with ND participants, T2D-met+ participants had higher fasting glucose, HbA1c, and insulin resistance than ND participants and lower levels of the insulin-sensitizing hormone adiponectin (P , 0.05). No other demographic, anthropometric, or clinical parameters were statistically different. 16S rRNA Gene Sequencing Gut microbiota communities were specific to each participant with marked intersubject differences (Fig. 1A) (overall interindividual generalized UniFrac distance = 0.720 6 0.009). We found high coverage across all groups of participants (mean Good’s coverage 6 SD = 0.990 6 0.001); 99% of OTUs were detected at least by two DNA reads, demonstrating thorough sampling of the gut microbiota. We next tested for differences in the number of observed OTUs across the groups of participants. We found no differences between participants with diabetes and ND participants (ANOSIM statistic R = 0.005, P value = 0.425) or between T2D-met+ and T2D-met2 participants (ANOSIM statistic R = 20.018, P = 0.557). The number of observed OTUs tended to be more similar between T2Dmet+ and ND than between T2D-met2 and ND participants (Supplementary Fig. 1); however, these differences were not statistically significant (T2D-met+ vs. ND: ANOSIM statistic R = 0.018, P = 0.348; T2D-met2 vs. ND: ANOSIM statistic R = 0.009, P = 0.409). We observed no significant differences in b diversity estimates among the three groups of participants (PERMANOVA: R2 = 0.019, P = 0.335) (Fig. 1A) or between participants with diabetes and ND participants (R2 = 0.009, P = 0.416) (Fig. 1B). However, the comparison between metformin and nonmetformin users reached significance (R2 = 0.013, P = 0.036) (Fig. 1C), demonstrating differences in the bacterial community structure associated with metformin use. The difference was also significant when comparing T2Dmet+ and ND participants (R2 = 0.015, P = 0.036) but not when comparing T2D-met2 and ND participants (R2 = 0.008, P = 0.943). These results suggested the microbial communities of T2D-met+ versus T2D-met2 were modestly phylogenetically dissimilar. We next used LEfSe to examine differences in the relative abundance of gut microbiota at the OTU level. Note that we were only interested in OTUs displaying strong associations in the LDA (represented by OTUs with [log10] LDA scores $3); such stringency resulted in fewer retained, but more likely biologically relevant, OTUs (19 displayed in Fig. 2 and PCo2 (6.03%) PCo1 (10.34%) ND R2 = 0.019 P = 0.34 T2D-met+ T2D-metPCo2 (6.03%) R2 = 0.009 P = 0.42 ND T2D PCo1 (10.34%) PCo2 (6.03%) metR2 = 0.013 P = 0.036 T2D-met+ PCo1 (10.34%) A B C Figure 1—Principal coordinates analysis based on generalized UniFrac. A: Comparison among the three groups of participants. B: Comparison between participants with diabetes and ND participants. C: Comparison between T2D-met+ and participants not taking metformin (T2D-met2 and ND). Ellipses encompass 75% of data distribution in each group of participants. R2 and P values from PERMANOVA. (A high-quality color representation of this figure is available in the online issue.) care.diabetesjournals.org de la Cuesta-Zuluaga and Associates 5