正在加载图片...

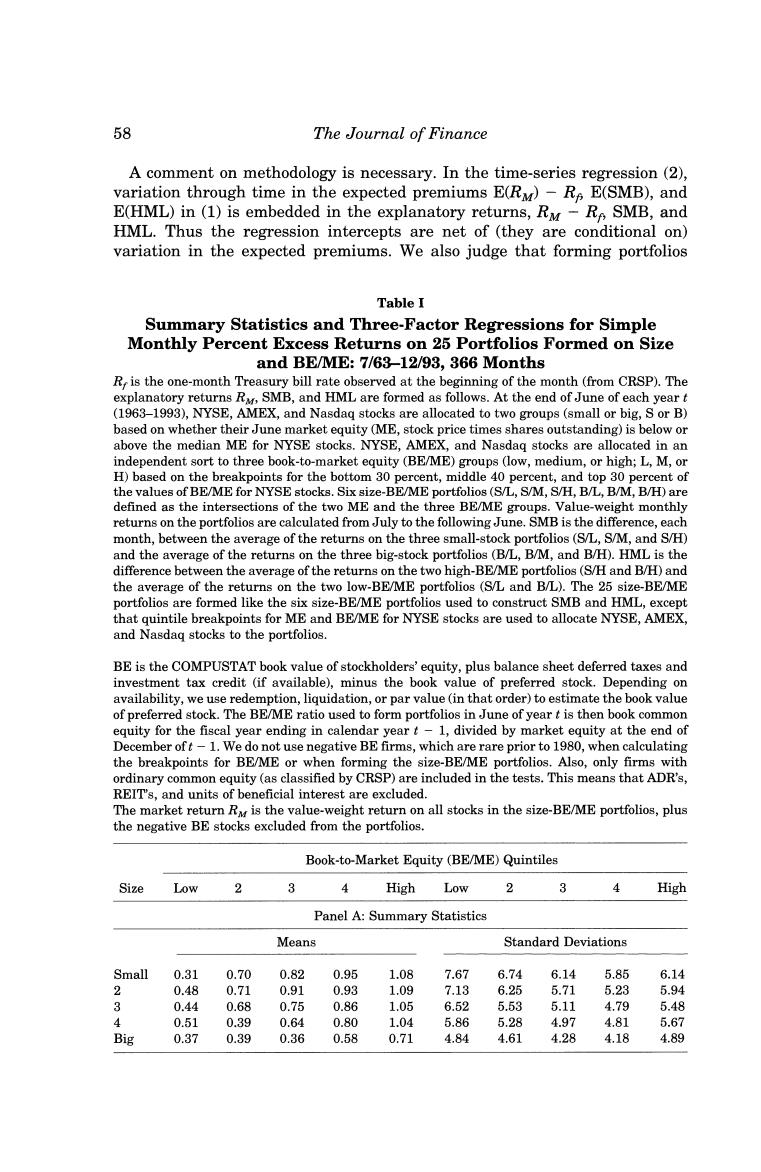
58 The Journal of Finance A comment on methodology is necessary.In the time-series regression(2), variation through time in the expected premiums E(RM)-Re E(SMB),and E(HML)in(1)is embedded in the explanatory returns,Ry-Re SMB,and HML.Thus the regression intercepts are net of (they are conditional on) variation in the expected premiums.We also judge that forming portfolios Table I Summary Statistics and Three-Factor Regressions for Simple Monthly Percent Excess Returns on 25 Portfolios Formed on Size and BE/ME:7/63-12/93,366 Months R,is the one-month Treasury bill rate observed at the beginning of the month (from CRSP).The explanatory returns R,SMB,and HML are formed as follows.At the end of June of each yeart (1963-1993),NYSE,AMEX,and Nasdaq stocks are allocated to two groups(small or big,S or B) based on whether their June market equity (ME,stock price times shares outstanding)is below or above the median ME for NYSE stocks.NYSE,AMEX,and Nasdag stocks are allocated in an independent sort to three book-to-market equity (BE/ME)groups (low,medium,or high;L,M,or H)based on the breakpoints for the bottom 30 percent,middle 40 percent,and top 30 percent of the values of BE/ME for NYSE stocks.Six size-BE/ME portfolios(S/L,S/M,S/H,B/L,B/M,B/H)are defined as the intersections of the two ME and the three BE/ME groups.Value-weight monthly returns on the portfolios are calculated from July to the following June.SMB is the difference,each month,between the average of the returns on the three small-stock portfolios(S/L.S/M,and S/H) and the average of the returns on the three big-stock portfolios(B/L,B/M,and B/H).HML is the difference between the average of the returns on the two high-BE/ME portfolios (S/H and B/H)and the average of the returns on the two low-BE/ME portfolios (S/L and B/L).The 25 size-BE/ME portfolios are formed like the six size-BE/ME portfolios used to construct SMB and HML,except that quintile breakpoints for ME and BE/ME for NYSE stocks are used to allocate NYSE,AMEX, and Nasdag stocks to the portfolios. BE is the COMPUSTAT book value of stockholders'equity,plus balance sheet deferred taxes and investment tax credit (if available),minus the book value of preferred stock.Depending on availability,we use redemption,liquidation,or par value(in that order)to estimate the book value of preferred stock.The BE/ME ratio used to form portfolios in June of year t is then book common equity for the fiscal year ending in calendar yeart-1,divided by market equity at the end of December oft-1.We do not use negative BE firms,which are rare prior to 1980,when calculating the breakpoints for BE/ME or when forming the size-BE/ME portfolios.Also,only firms with ordinary common equity (as classified by CRSP)are included in the tests.This means that ADR's, REIT's,and units of beneficial interest are excluded. The market return R is the value-weight return on all stocks in the size-BE/ME portfolios,plus the negative BE stocks excluded from the portfolios. Book-to-Market Equity (BE/ME)Quintiles Size Low 2 4 High Low 2 3 High Panel A:Summary Statistics Means Standard Deviations Small 0.31 0.70 0.82 0.95 1.08 7.67 6.74 6.14 5.85 6.14 2 0.48 0.71 0.91 0.93 1.09 7.13 6.25 5.71 5.23 5.94 3 0.44 0.68 0.75 0.86 1.05 6.52 5.53 5.11 4.79 5.48 4 0.51 0.39 0.64 0.80 1.04 5.86 5.28 4.97 4.81 5.67 Big 0.37 0.39 0.36 0.58 0.71 4.84 4.61 4.28 4.18 4.89