正在加载图片...

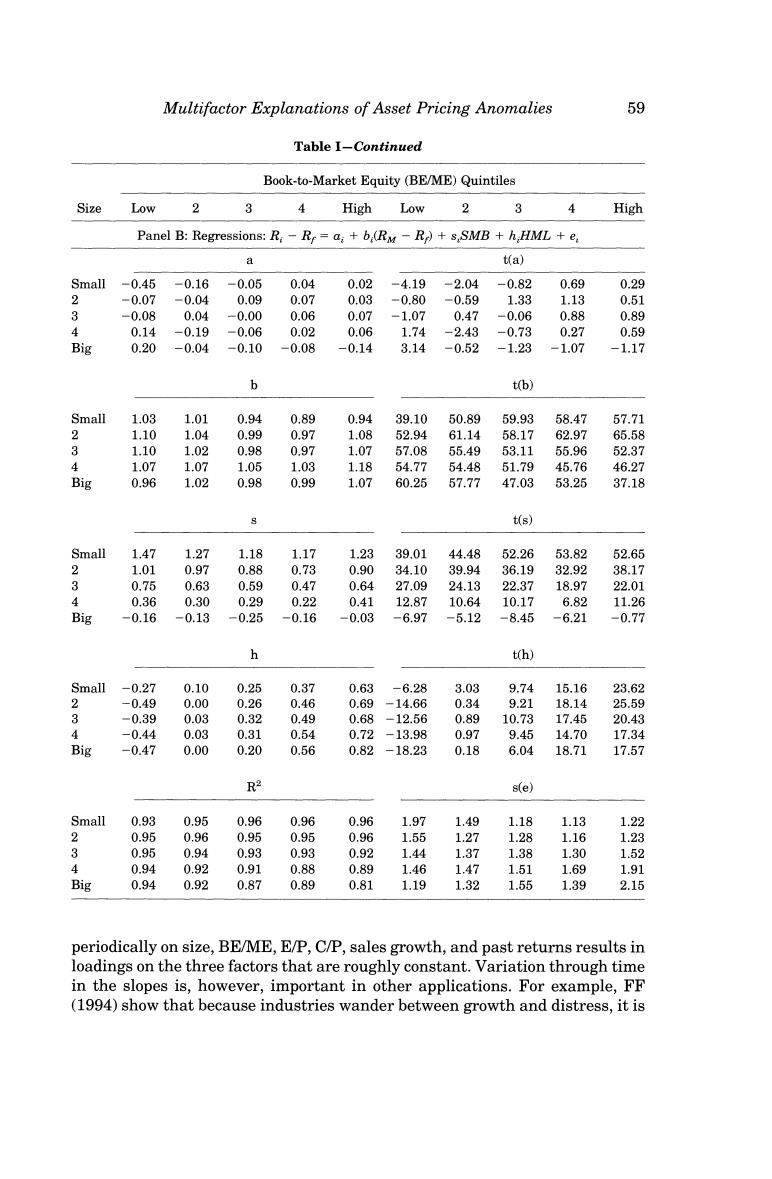
Multifactor Explanations of Asset Pricing Anomalies 59 Table I-Continued Book-to-Market Equity (BE/ME)Quintiles Size Low 2 3 4 High Low 2 3 4 High Panel B:Regressions:R:-Rr=a;+b (RM -R)+s,SMB +h HML +e 9 t(a) Small -0.45 -0.16 -0.05 0.04 0.02 -4.19 -2.04 -0.82 0.69 0.29 2 -0.07 -0.04 0.09 0.07 0.03 -0.80 -0.59 1.33 1.13 0.51 3 -0.08 0.04 -0.00 0.06 0.07 -1.07 0.47 -0.06 0.88 0.89 4 0.14 -0.19 -0.06 0.02 0.06 1.74 -2.43 -0.73 0.27 0.59 Big 0.20 -0.04 -0.10 -0.08 -0.14 3.14 -0.52 -1.23 -1.07 -1.17 b t(b) Small 1.03 1.01 0.94 0.89 0.94 39.10 50.89 59.93 58.47 57.71 2 1.10 1.04 0.99 0.97 1.08 52.94 61.14 58.17 62.97 65.58 3 1.10 1.02 0.98 0.97 1.07 57.08 55.49 53.11 55.96 52.37 4 1.07 1.07 1.05 1.03 1.18 54.77 54.48 51.79 45.76 46.27 Big 0.96 1.02 0.98 0.99 1.07 60.25 57.77 47.03 53.25 37.18 t(s) Small 1.47 1.27 1.18 1.17 1.23 39.01 44.48 52.26 53.82 52.65 2 1.01 0.97 0.88 0.73 0.90 34.10 39.94 36.19 32.92 38.17 3 0.75 0.63 0.59 0.47 0.64 27.09 24.13 22.37 18.97 22.01 4 0.36 0.30 0.29 0.22 0.41 12.87 10.64 10.17 6.82 11.26 Big -0.16 -0.13 -0.25 -0.16 -0.03 -6.97 -5.12 -8.45 -6.21 -0.77 h t(h) Smal1-0.27 0.10 0.25 0.37 0.63 -6.28 3.03 9.74 15.16 23.62 2 -0.49 0.00 0.26 0.46 0.69 -14.66 0.34 9.21 18.14 25.59 3 -0.39 0.03 0.32 0.49 0.68 -12.56 0.89 10.73 17.45 20.43 4 -0.44 0.03 0.31 0.54 0.72 -13.98 0.97 9.45 14.70 17.34 Big -0.47 0.00 0.20 0.56 0.82 -18.23 0.18 6.04 18.71 17.57 R2 s(e) Small 0.93 0.95 0.96 0.96 0.96 1.97 1.49 1.18 1.13 1.22 2 0.95 0.96 0.95 0.95 0.96 1.55 1.27 1.28 1.16 1.23 3 0.95 0.94 0.93 0.93 0.92 1.44 1.37 1.38 1.30 1.52 4 0.94 0.92 0.91 0.88 0.89 1.46 1.47 1.51 1.69 1.91 Big 0.94 0.92 0.87 0.89 0.81 1.19 1.32 1.55 1.39 2.15 periodically on size,BE/ME,E/P,C/P,sales growth,and past returns results in loadings on the three factors that are roughly constant.Variation through time in the slopes is,however,important in other applications.For example,FF (1994)show that because industries wander between growth and distress,it is