正在加载图片...
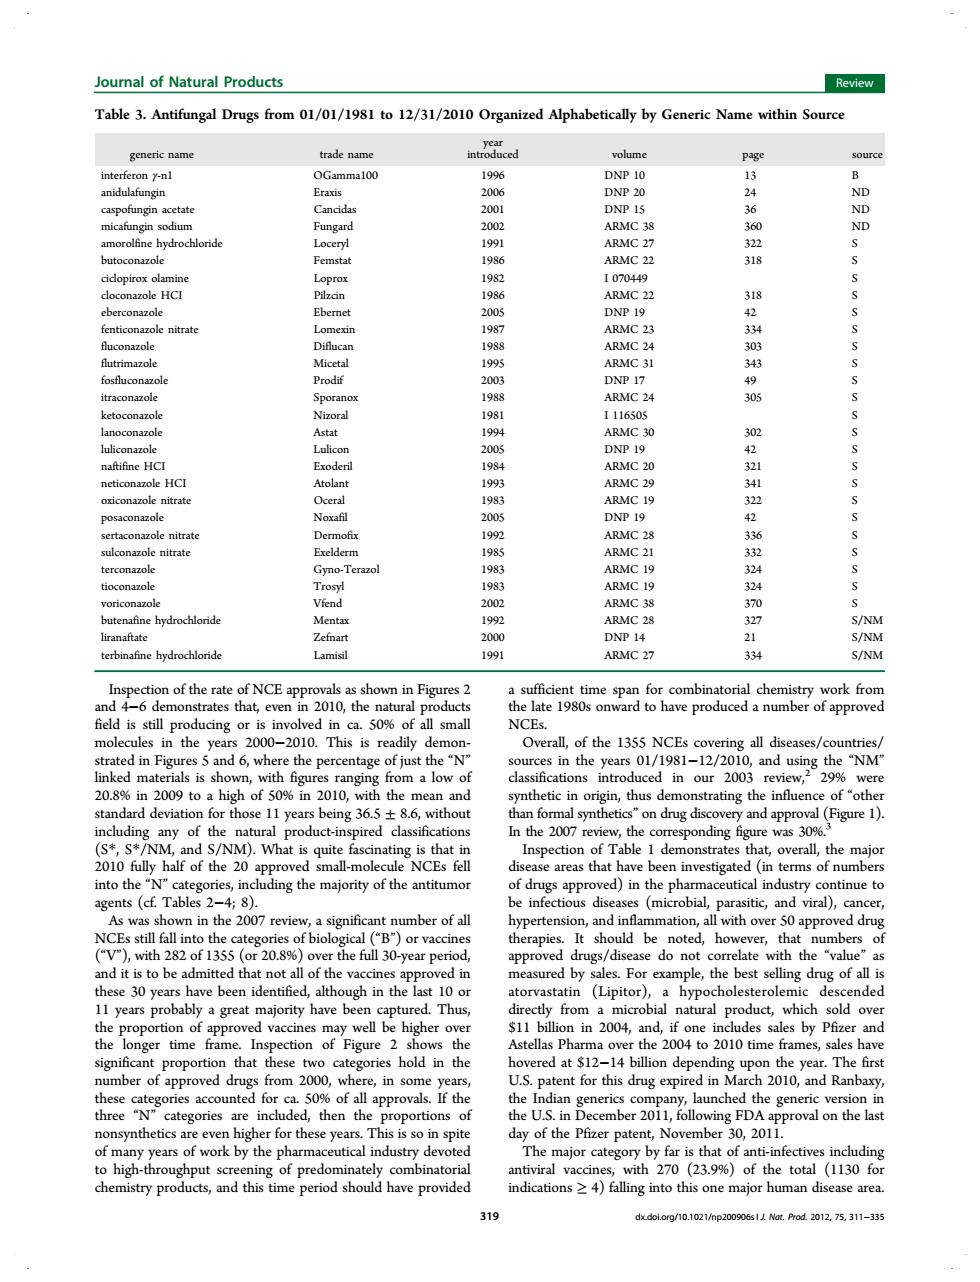
lournal of Na Table 3 Antifungal drug 01/01/198 12/31/201 rate of NCE rial ch 13s e nto the ing the majority of the antitumo ed)in the pharma inue gents fall i he .S be t is to be pe ar 吧 tim 010 time ha 200 and the yea 270 (23.9%)of the total (3 f stry pr ling into Inspection of the rate of NCE approvals as shown in Figures 2 and 4−6 demonstrates that, even in 2010, the natural products field is still producing or is involved in ca. 50% of all small molecules in the years 2000−2010. This is readily demonstrated in Figures 5 and 6, where the percentage of just the “N” linked materials is shown, with figures ranging from a low of 20.8% in 2009 to a high of 50% in 2010, with the mean and standard deviation for those 11 years being 36.5 ± 8.6, without including any of the natural product-inspired classifications (S*, S*/NM, and S/NM). What is quite fascinating is that in 2010 fully half of the 20 approved small-molecule NCEs fell into the “N” categories, including the majority of the antitumor agents (cf. Tables 2−4; 8). As was shown in the 2007 review, a significant number of all NCEs still fall into the categories of biological (“B”) or vaccines (“V”), with 282 of 1355 (or 20.8%) over the full 30-year period, and it is to be admitted that not all of the vaccines approved in these 30 years have been identified, although in the last 10 or 11 years probably a great majority have been captured. Thus, the proportion of approved vaccines may well be higher over the longer time frame. Inspection of Figure 2 shows the significant proportion that these two categories hold in the number of approved drugs from 2000, where, in some years, these categories accounted for ca. 50% of all approvals. If the three “N” categories are included, then the proportions of nonsynthetics are even higher for these years. This is so in spite of many years of work by the pharmaceutical industry devoted to high-throughput screening of predominately combinatorial chemistry products, and this time period should have provided a sufficient time span for combinatorial chemistry work from the late 1980s onward to have produced a number of approved NCEs. Overall, of the 1355 NCEs covering all diseases/countries/ sources in the years 01/1981−12/2010, and using the “NM” classifications introduced in our 2003 review,2 29% were synthetic in origin, thus demonstrating the influence of “other than formal synthetics” on drug discovery and approval (Figure 1). In the 2007 review, the corresponding figure was 30%.3 Inspection of Table 1 demonstrates that, overall, the major disease areas that have been investigated (in terms of numbers of drugs approved) in the pharmaceutical industry continue to be infectious diseases (microbial, parasitic, and viral), cancer, hypertension, and inflammation, all with over 50 approved drug therapies. It should be noted, however, that numbers of approved drugs/disease do not correlate with the “value” as measured by sales. For example, the best selling drug of all is atorvastatin (Lipitor), a hypocholesterolemic descended directly from a microbial natural product, which sold over $11 billion in 2004, and, if one includes sales by Pfizer and Astellas Pharma over the 2004 to 2010 time frames, sales have hovered at $12−14 billion depending upon the year. The first U.S. patent for this drug expired in March 2010, and Ranbaxy, the Indian generics company, launched the generic version in the U.S. in December 2011, following FDA approval on the last day of the Pfizer patent, November 30, 2011. The major category by far is that of anti-infectives including antiviral vaccines, with 270 (23.9%) of the total (1130 for indications ≥ 4) falling into this one major human disease area. Table 3. Antifungal Drugs from 01/01/1981 to 12/31/2010 Organized Alphabetically by Generic Name within Source generic name trade name year introduced volume page source interferon γ-n1 OGamma100 1996 DNP 10 13 B anidulafungin Eraxis 2006 DNP 20 24 ND caspofungin acetate Cancidas 2001 DNP 15 36 ND micafungin sodium Fungard 2002 ARMC 38 360 ND amorolfine hydrochloride Loceryl 1991 ARMC 27 322 S butoconazole Femstat 1986 ARMC 22 318 S ciclopirox olamine Loprox 1982 I 070449 S cloconazole HCI Pilzcin 1986 ARMC 22 318 S eberconazole Ebernet 2005 DNP 19 42 S fenticonazole nitrate Lomexin 1987 ARMC 23 334 S fluconazole Diflucan 1988 ARMC 24 303 S flutrimazole Micetal 1995 ARMC 31 343 S fosfluconazole Prodif 2003 DNP 17 49 S itraconazole Sporanox 1988 ARMC 24 305 S ketoconazole Nizoral 1981 I 116505 S lanoconazole Astat 1994 ARMC 30 302 S luliconazole Lulicon 2005 DNP 19 42 S naftifine HCI Exoderil 1984 ARMC 20 321 S neticonazole HCI Atolant 1993 ARMC 29 341 S oxiconazole nitrate Oceral 1983 ARMC 19 322 S posaconazole Noxafil 2005 DNP 19 42 S sertaconazole nitrate Dermofix 1992 ARMC 28 336 S sulconazole nitrate Exelderm 1985 ARMC 21 332 S terconazole Gyno-Terazol 1983 ARMC 19 324 S tioconazole Trosyl 1983 ARMC 19 324 S voriconazole Vfend 2002 ARMC 38 370 S butenafine hydrochloride Mentax 1992 ARMC 28 327 S/NM liranaftate Zefnart 2000 DNP 14 21 S/NM terbinafine hydrochloride Lamisil 1991 ARMC 27 334 S/NM Journal of Natural Products Review 319 dx.doi.org/10.1021/np200906s | J. Nat. Prod. 2012, 75, 311−335