正在加载图片...
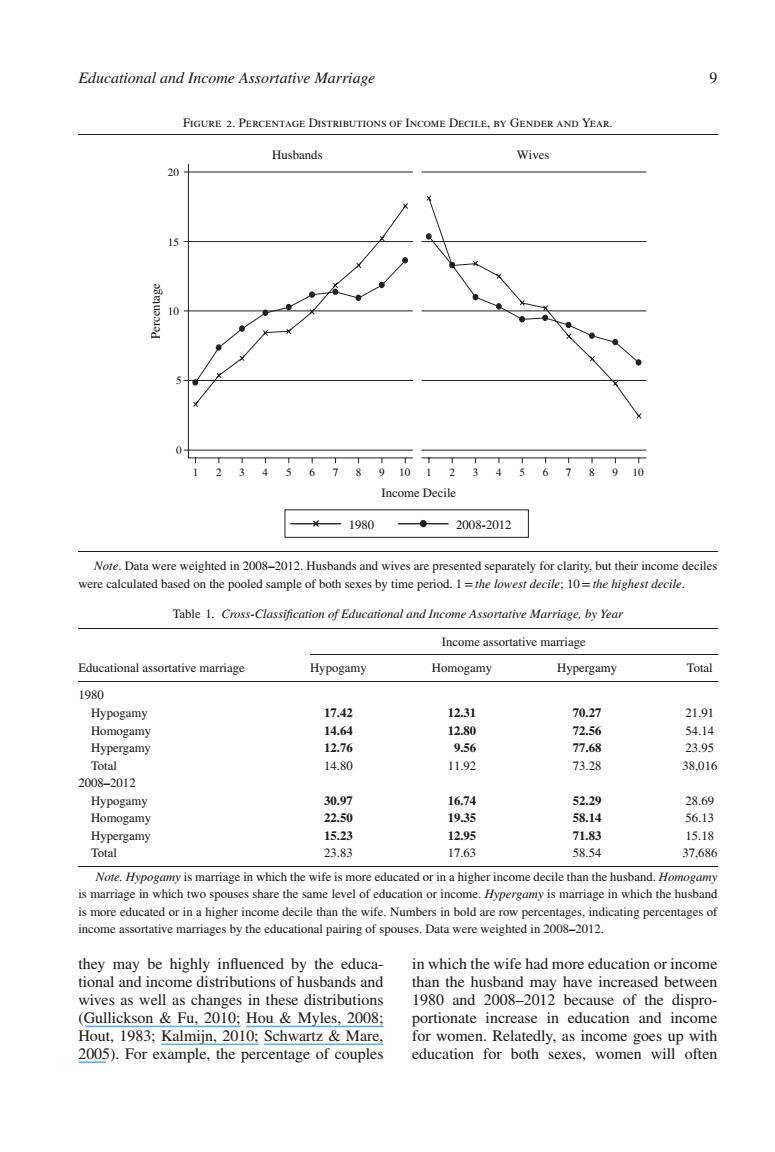
Educational and Income Assortative Marriage 9 FIGURE 2.PERCENTAGE DISTRIBUTIONS OF INCOME DECILE,BY GENDER AND YEAR. Husbands Wives 20 15 10 91012 10 Income Decile ×—1980 —◆—2008.2012 Note.Data were weighted in 2008-2012.Husbands and wives are presented separately for clarity,but their income deciles were calculated based on the pooled sample of both sexes by time period.1=the lowest decile:10=the highest decile. Table 1.Cross-Classification of Educational and Income Assortative Marriage,by Year Income assortative marriage Educational assortative marriage Hypogamy Homogamy Hypergamy Total 1980 Hypogamy 17.42 12.31 70.27 21.91 Homogamy 14.64 12.80 72.56 54.14 Hypergamy 12.76 9.56 77.68 23.95 Total 14.80 11.92 73.28 38,016 2008-2012 Hypogamy 30.97 16.74 52.29 28.69 Homogamy 22.50 1935 58.14 56.13 Hypergamy 15.23 12.95 71.83 15.18 Total 23.83 17.63 58.54 37,686 Note.Hypogamy is marriage in which the wife is more educated or in a higher income decile than the husband.Homogamy is marriage in which two spouses share the same level of education or income.Hypergamy is marriage in which the husband is more educated or in a higher income decile than the wife.Numbers in bold are row percentages,indicating percentages of income assortative marriages by the educational pairing of spouses.Data were weighted in 2008-2012. they may be highly influenced by the educa- in which the wife had more education or income tional and income distributions of husbands and than the husband may have increased between wives as well as changes in these distributions 1980 and 2008-2012 because of the dispro- (Gullickson Fu,2010;Hou Myles,2008; portionate increase in education and income Hout,1983;Kalmijn,2010;Schwartz Mare, for women.Relatedly,as income goes up with 2005).For example,the percentage of couples education for both sexes,women will oftenEducational and Income Assortative Marriage 9 Figure 2. Percentage Distributions of Income Decile, by Gender and Year. 0 5 10 15 20 1 2 3 4 5 6 7 8 9 10 1 2 3 4 5 6 7 8 9 10 Husbands Wives 1980 2008-2012 Percentage Income Decile Note. Data were weighted in 2008–2012. Husbands and wives are presented separately for clarity, but their income deciles were calculated based on the pooled sample of both sexes by time period. 1=the lowest decile; 10=the highest decile. Table 1. Cross-Classification of Educational and Income Assortative Marriage, by Year Income assortative marriage Educational assortative marriage Hypogamy Homogamy Hypergamy Total 1980 Hypogamy 17.42 12.31 70.27 21.91 Homogamy 14.64 12.80 72.56 54.14 Hypergamy 12.76 9.56 77.68 23.95 Total 14.80 11.92 73.28 38,016 2008–2012 Hypogamy 30.97 16.74 52.29 28.69 Homogamy 22.50 19.35 58.14 56.13 Hypergamy 15.23 12.95 71.83 15.18 Total 23.83 17.63 58.54 37,686 Note. Hypogamy is marriage in which the wife is more educated or in a higher income decile than the husband. Homogamy is marriage in which two spouses share the same level of education or income. Hypergamy is marriage in which the husband is more educated or in a higher income decile than the wife. Numbers in bold are row percentages, indicating percentages of income assortative marriages by the educational pairing of spouses. Data were weighted in 2008–2012. they may be highly influenced by the educational and income distributions of husbands and wives as well as changes in these distributions (Gullickson & Fu, 2010; Hou & Myles, 2008; Hout, 1983; Kalmijn, 2010; Schwartz & Mare, 2005). For example, the percentage of couples in which the wife had more education or income than the husband may have increased between 1980 and 2008–2012 because of the disproportionate increase in education and income for women. Relatedly, as income goes up with education for both sexes, women will often