正在加载图片...
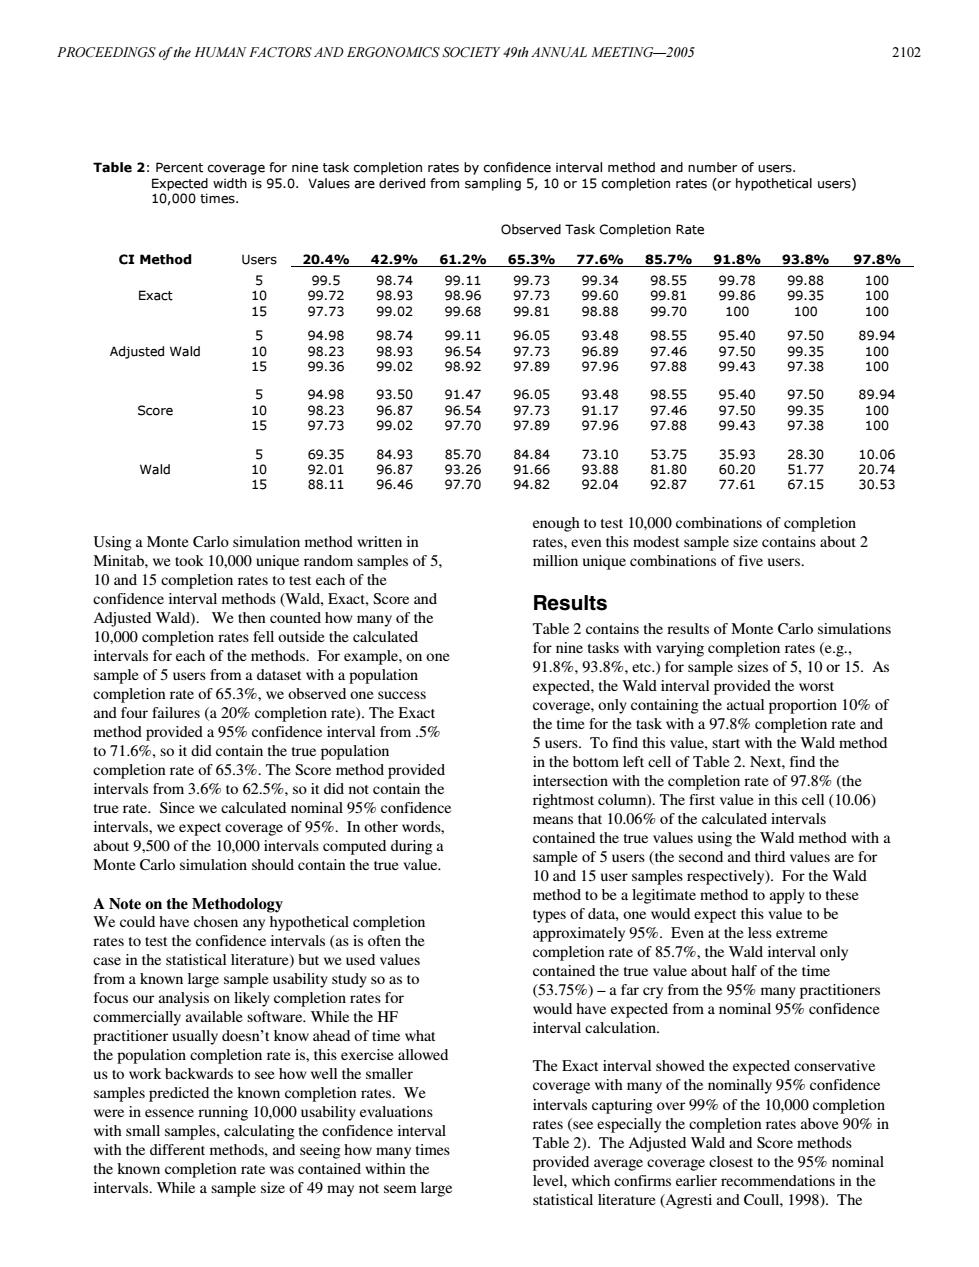
PROCEEDINGS of the HUMAN FACTORS AND ERGONOMICS SOCIETY 49th ANNUAL MEETING-2005 2102 Table 2:Percent coverage for nine task completion rates by confidence interval method and number of users. Expected width is 95.0.Values are derived from sampling 5,10 or 15 completion rates (or hypothetical users) 10,000 times. Observed Task Completion Rate CI Method Users20.4/%42.9%61.2%65.3%77.6%85.7%91.8%93.8%97.8% 5 99.5 98.74 99.11 99.73 99.34 98.55 99.78 99.88 100 Exact 10 99.72 98.93 98.96 97.73 99.60 99.81 99.86 99.35 100 15 97.73 99.02 99.68 99.81 98.88 99.70 100 100 100 5 94.98 98.74 99.11 96.05 93.48 98.55 95.40 97.50 89.94 Adjusted Wald 10 98.23 98.93 96.54 97.73 96.89 97.46 97.50 99.35 100 15 99.36 99.02 98.92 97.89 97.96 97.88 99.43 97.38 100 5 94.98 93.50 91.47 96.05 93.48 98.55 95.40 97.50 89.94 Score 10 98.23 96.87 96.54 97.73 91.17 97.46 97.50 99.35 100 15 97.73 99.02 97.70 97.89 97.96 97.88 99.43 97.38 100 69.35 84.93 85.70 84.84 73.10 53.75 35.93 28.30 10.06 Wald 92.01 96.87 93.26 91.66 93.88 81.80 60.20 51.77 20.74 15 88.11 96.46 97.70 94.82 92.04 92.87 77.61 67.15 30.53 enough to test 10,000 combinations of completion Using a Monte Carlo simulation method written in rates,even this modest sample size contains about 2 Minitab,we took 10,000 unique random samples of 5, million unique combinations of five users. 10 and 15 completion rates to test each of the confidence interval methods (Wald,Exact,Score and Results Adjusted Wald).We then counted how many of the 10,000 completion rates fell outside the calculated Table 2 contains the results of Monte Carlo simulations intervals for each of the methods.For example,on one for nine tasks with varying completion rates (e.g., sample of 5 users from a dataset with a population 91.8%,93.8%,etc.)for sample sizes of 5,10 or 15.As completion rate of 65.3%,we observed one success expected,the Wald interval provided the worst and four failures (a 20%completion rate).The Exact coverage,only containing the actual proportion 10%of method provided a 95%confidence interval from.5% the time for the task with a 97.8%completion rate and to 71.6%,so it did contain the true population 5 users.To find this value,start with the Wald method completion rate of 65.3%.The Score method provided in the bottom left cell of Table 2.Next,find the intervals from 3.6%to 62.5%,so it did not contain the intersection with the completion rate of 97.8%(the true rate.Since we calculated nominal 95%confidence rightmost column).The first value in this cell (10.06) intervals,we expect coverage of 95%.In other words, means that 10.06%of the calculated intervals about 9,500 of the 10,000 intervals computed during a contained the true values using the Wald method with a Monte Carlo simulation should contain the true value. sample of 5 users (the second and third values are for 10 and 15 user samples respectively).For the Wald A Note on the Methodology method to be a legitimate method to apply to these We could have chosen any hypothetical completion types of data,one would expect this value to be rates to test the confidence intervals (as is often the approximately 95%.Even at the less extreme case in the statistical literature)but we used values completion rate of 85.7%,the Wald interval only from a known large sample usability study so as to contained the true value about half of the time focus our analysis on likely completion rates for (53.75%)-a far cry from the 95%many practitioners commercially available software.While the HF would have expected from a nominal 95%confidence practitioner usually doesn't know ahead of time what interval calculation. the population completion rate is,this exercise allowed us to work backwards to see how well the smaller The Exact interval showed the expected conservative samples predicted the known completion rates.We coverage with many of the nominally 95%confidence were in essence running 10,000 usability evaluations intervals capturing over 99%of the 10,000 completion with small samples,calculating the confidence interval rates(see especially the completion rates above 90%in with the different methods,and seeing how many times Table 2).The Adjusted Wald and Score methods the known completion rate was contained within the provided average coverage closest to the 95%nominal intervals.While a sample size of 49 may not seem large level,which confirms earlier recommendations in the statistical literature (Agresti and Coull,1998).TheUsing a Monte Carlo simulation method written in Minitab, we took 10,000 unique random samples of 5, 10 and 15 completion rates to test each of the confidence interval methods (Wald, Exact, Score and Adjusted Wald). We then counted how many of the 10,000 completion rates fell outside the calculated intervals for each of the methods. For example, on one sample of 5 users from a dataset with a population completion rate of 65.3%, we observed one success and four failures (a 20% completion rate). The Exact method provided a 95% confidence interval from .5% to 71.6%, so it did contain the true population completion rate of 65.3%. The Score method provided intervals from 3.6% to 62.5%, so it did not contain the true rate. Since we calculated nominal 95% confidence intervals, we expect coverage of 95%. In other words, about 9,500 of the 10,000 intervals computed during a Monte Carlo simulation should contain the true value. A Note on the Methodology We could have chosen any hypothetical completion rates to test the confidence intervals (as is often the case in the statistical literature) but we used values from a known large sample usability study so as to focus our analysis on likely completion rates for commercially available software. While the HF practitioner usually doesn’t know ahead of time what the population completion rate is, this exercise allowed us to work backwards to see how well the smaller samples predicted the known completion rates. We were in essence running 10,000 usability evaluations with small samples, calculating the confidence interval with the different methods, and seeing how many times the known completion rate was contained within the intervals. While a sample size of 49 may not seem large enough to test 10,000 combinations of completion rates, even this modest sample size contains about 2 million unique combinations of five users. Results Table 2 contains the results of Monte Carlo simulations for nine tasks with varying completion rates (e.g., 91.8%, 93.8%, etc.) for sample sizes of 5, 10 or 15. As expected, the Wald interval provided the worst coverage, only containing the actual proportion 10% of the time for the task with a 97.8% completion rate and 5 users. To find this value, start with the Wald method in the bottom left cell of Table 2. Next, find the intersection with the completion rate of 97.8% (the rightmost column). The first value in this cell (10.06) means that 10.06% of the calculated intervals contained the true values using the Wald method with a sample of 5 users (the second and third values are for 10 and 15 user samples respectively). For the Wald method to be a legitimate method to apply to these types of data, one would expect this value to be approximately 95%. Even at the less extreme completion rate of 85.7%, the Wald interval only contained the true value about half of the time (53.75%) – a far cry from the 95% many practitioners would have expected from a nominal 95% confidence interval calculation. The Exact interval showed the expected conservative coverage with many of the nominally 95% confidence intervals capturing over 99% of the 10,000 completion rates (see especially the completion rates above 90% in Table 2). The Adjusted Wald and Score methods provided average coverage closest to the 95% nominal level, which confirms earlier recommendations in the statistical literature (Agresti and Coull, 1998). The Table 2: Percent coverage for nine task completion rates by confidence interval method and number of users. Expected width is 95.0. Values are derived from sampling 5, 10 or 15 completion rates (or hypothetical users) 10,000 times. Observed Task Completion Rate CI Method Users 20.4% 42.9% 61.2% 65.3% 77.6% 85.7% 91.8% 93.8% 97.8% Exact 5 10 15 99.5 99.72 97.73 98.74 98.93 99.02 99.11 98.96 99.68 99.73 97.73 99.81 99.34 99.60 98.88 98.55 99.81 99.70 99.78 99.86 100 99.88 99.35 100 100 100 100 Adjusted Wald 5 10 15 94.98 98.23 99.36 98.74 98.93 99.02 99.11 96.54 98.92 96.05 97.73 97.89 93.48 96.89 97.96 98.55 97.46 97.88 95.40 97.50 99.43 97.50 99.35 97.38 89.94 100 100 Score 5 10 15 94.98 98.23 97.73 93.50 96.87 99.02 91.47 96.54 97.70 96.05 97.73 97.89 93.48 91.17 97.96 98.55 97.46 97.88 95.40 97.50 99.43 97.50 99.35 97.38 89.94 100 100 Wald 5 10 15 69.35 92.01 88.11 84.93 96.87 96.46 85.70 93.26 97.70 84.84 91.66 94.82 73.10 93.88 92.04 53.75 81.80 92.87 35.93 60.20 77.61 28.30 51.77 67.15 10.06 20.74 30.53 PROCEEDINGS of the HUMAN FACTORS AND ERGONOMICS SOCIETY 49th ANNUAL MEETING—2005 2102