正在加载图片...
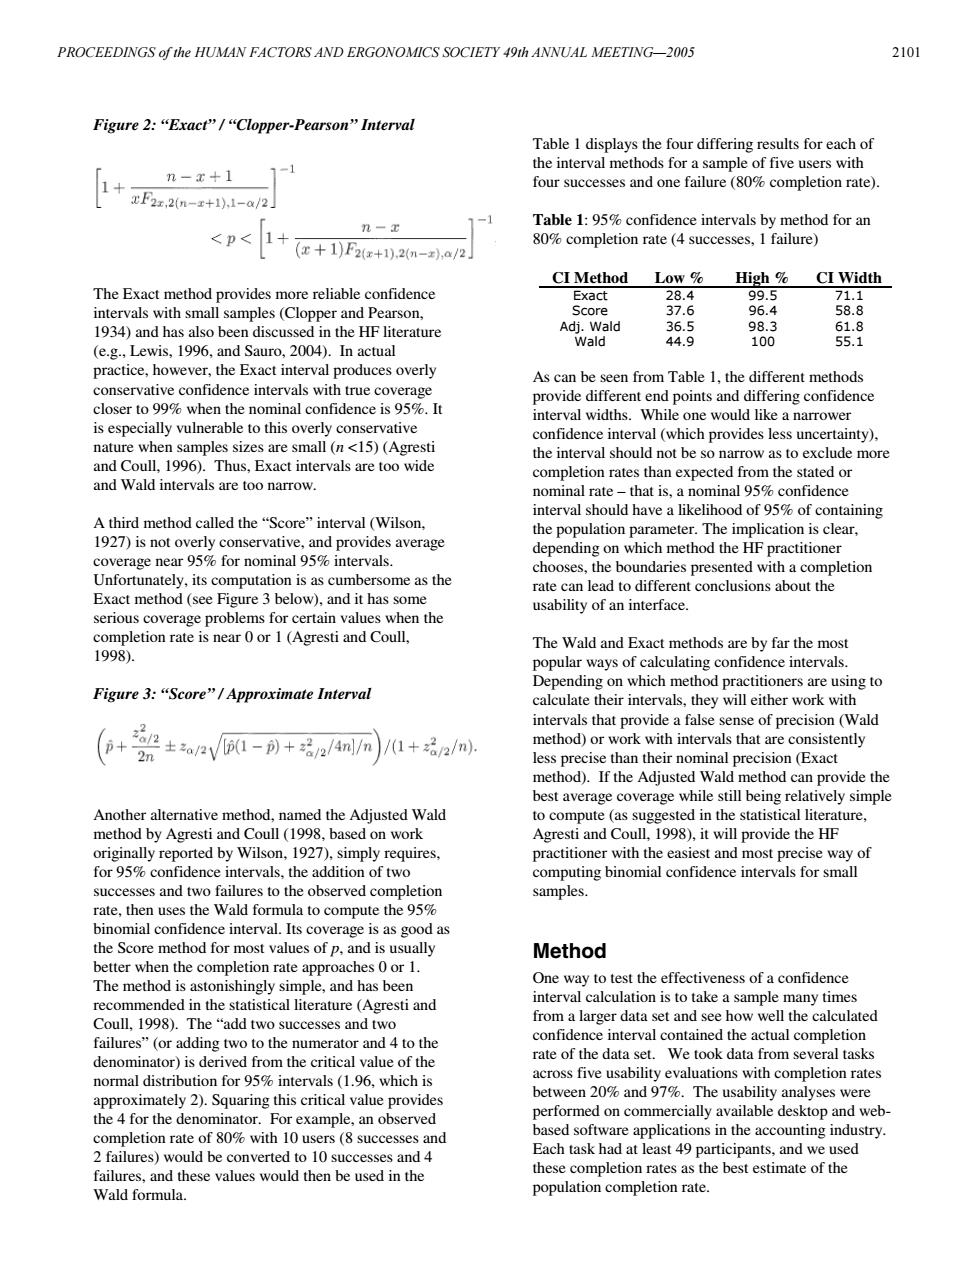
PROCEEDINGS of the HUMAN FACTORS AND ERGONOMICS SOCIETY 49th ANNUAL MEETING-2005 2101 Figure2:“Exact'”/“Clopper-Pearson”Interval Table I displays the four differing results for each of the interval methods for a sample of five users with n-x+1 four successes and one failure (80%completion rate). F2x,2n-x+11-a/2 n一① Table 1:95%confidence intervals by method for an < (x+1)F2(x+1),2(n-,a/2 80%completion rate (4 successes,1 failure) CI Method Low High CI Width The Exact method provides more reliable confidence Exact 28.4 99.5 71.1 intervals with small samples(Clopper and Pearson, Score 37.6 96.4 58.8 1934)and has also been discussed in the HF literature Adj.Wald 36.5 98.3 61.8 Wald 44.9 100 (e.g.,Lewis,1996,and Sauro,2004).In actual 55.1 practice,however,the Exact interval produces overly As can be seen from Table 1,the different methods conservative confidence intervals with true coverage provide different end points and differing confidence closer to 99%when the nominal confidence is 95%.It interval widths.While one would like a narrower is especially vulnerable to this overly conservative confidence interval(which provides less uncertainty), nature when samples sizes are small(n <15)(Agresti the interval should not be so narrow as to exclude more and Coull,1996).Thus,Exact intervals are too wide completion rates than expected from the stated or and Wald intervals are too narrow. nominal rate-that is,a nominal 95%confidence interval should have a likelihood of 95%of containing A third method called the "Score"interval (Wilson. the population parameter.The implication is clear, 1927)is not overly conservative,and provides average depending on which method the HF practitioner coverage near 95%for nominal 95%intervals chooses,the boundaries presented with a completion Unfortunately,its computation is as cumbersome as the rate can lead to different conclusions about the Exact method(see Figure 3 below),and it has some usability of an interface. serious coverage problems for certain values when the completion rate is near 0 or 1 (Agresti and Coull, The Wald and Exact methods are by far the most 1998). popular ways of calculating confidence intervals. Depending on which method practitioners are using to Figure3:“Score”/Approximate Interval calculate their intervals,they will either work with intervals that provide a false sense of precision (Wald + method)or work with intervals that are consistently 2n /1+2a/2/n). less precise than their nominal precision(Exact method).If the Adjusted Wald method can provide the best average coverage while still being relatively simple Another alternative method,named the Adjusted Wald to compute(as suggested in the statistical literature, method by Agresti and Coull(1998,based on work Agresti and Coull,1998),it will provide the HF originally reported by Wilson,1927),simply requires, practitioner with the easiest and most precise way of for 95%confidence intervals.the addition of two computing binomial confidence intervals for small successes and two failures to the observed completion samples. rate,then uses the Wald formula to compute the 95% binomial confidence interval.Its coverage is as good as the Score method for most values of p,and is usually Method better when the completion rate approaches 0 or 1. The method is astonishingly simple,and has been One way to test the effectiveness of a confidence recommended in the statistical literature (Agresti and interval calculation is to take a sample many times Coull,1998).The "add two successes and two from a larger data set and see how well the calculated failures"(or adding two to the numerator and 4 to the confidence interval contained the actual completion denominator)is derived from the critical value of the rate of the data set.We took data from several tasks normal distribution for 95%intervals(1.96,which is across five usability evaluations with completion rates approximately 2).Squaring this critical value provides between 20%and 97%.The usability analyses were the 4 for the denominator.For example,an observed performed on commercially available desktop and web- completion rate of 80%with 10 users (8 successes and based software applications in the accounting industry. 2 failures)would be converted to 10 successes and 4 Each task had at least 49 participants,and we used failures,and these values would then be used in the these completion rates as the best estimate of the Wald formula. population completion rate.Figure 2: “Exact” / “Clopper-Pearson” Interval The Exact method provides more reliable confidence intervals with small samples (Clopper and Pearson, 1934) and has also been discussed in the HF literature (e.g., Lewis, 1996, and Sauro, 2004). In actual practice, however, the Exact interval produces overly conservative confidence intervals with true coverage closer to 99% when the nominal confidence is 95%. It is especially vulnerable to this overly conservative nature when samples sizes are small (n <15) (Agresti and Coull, 1996). Thus, Exact intervals are too wide and Wald intervals are too narrow. A third method called the “Score” interval (Wilson, 1927) is not overly conservative, and provides average coverage near 95% for nominal 95% intervals. Unfortunately, its computation is as cumbersome as the Exact method (see Figure 3 below), and it has some serious coverage problems for certain values when the completion rate is near 0 or 1 (Agresti and Coull, 1998). Figure 3: “Score” / Approximate Interval Another alternative method, named the Adjusted Wald method by Agresti and Coull (1998, based on work originally reported by Wilson, 1927), simply requires, for 95% confidence intervals, the addition of two successes and two failures to the observed completion rate, then uses the Wald formula to compute the 95% binomial confidence interval. Its coverage is as good as the Score method for most values of p, and is usually better when the completion rate approaches 0 or 1. The method is astonishingly simple, and has been recommended in the statistical literature (Agresti and Coull, 1998). The “add two successes and two failures” (or adding two to the numerator and 4 to the denominator) is derived from the critical value of the normal distribution for 95% intervals (1.96, which is approximately 2). Squaring this critical value provides the 4 for the denominator. For example, an observed completion rate of 80% with 10 users (8 successes and 2 failures) would be converted to 10 successes and 4 failures, and these values would then be used in the Wald formula. Table 1 displays the four differing results for each of the interval methods for a sample of five users with four successes and one failure (80% completion rate). Table 1: 95% confidence intervals by method for an 80% completion rate (4 successes, 1 failure) CI Method Low % High % CI Width Exact 28.4 99.5 71.1 Score 37.6 96.4 58.8 Adj. Wald 36.5 98.3 61.8 Wald 44.9 100 55.1 As can be seen from Table 1, the different methods provide different end points and differing confidence interval widths. While one would like a narrower confidence interval (which provides less uncertainty), the interval should not be so narrow as to exclude more completion rates than expected from the stated or nominal rate – that is, a nominal 95% confidence interval should have a likelihood of 95% of containing the population parameter. The implication is clear, depending on which method the HF practitioner chooses, the boundaries presented with a completion rate can lead to different conclusions about the usability of an interface. The Wald and Exact methods are by far the most popular ways of calculating confidence intervals. Depending on which method practitioners are using to calculate their intervals, they will either work with intervals that provide a false sense of precision (Wald method) or work with intervals that are consistently less precise than their nominal precision (Exact method). If the Adjusted Wald method can provide the best average coverage while still being relatively simple to compute (as suggested in the statistical literature, Agresti and Coull, 1998), it will provide the HF practitioner with the easiest and most precise way of computing binomial confidence intervals for small samples. Method One way to test the effectiveness of a confidence interval calculation is to take a sample many times from a larger data set and see how well the calculated confidence interval contained the actual completion rate of the data set. We took data from several tasks across five usability evaluations with completion rates between 20% and 97%. The usability analyses were performed on commercially available desktop and webbased software applications in the accounting industry. Each task had at least 49 participants, and we used these completion rates as the best estimate of the population completion rate. PROCEEDINGS of the HUMAN FACTORS AND ERGONOMICS SOCIETY 49th ANNUAL MEETING—2005 2101