正在加载图片...

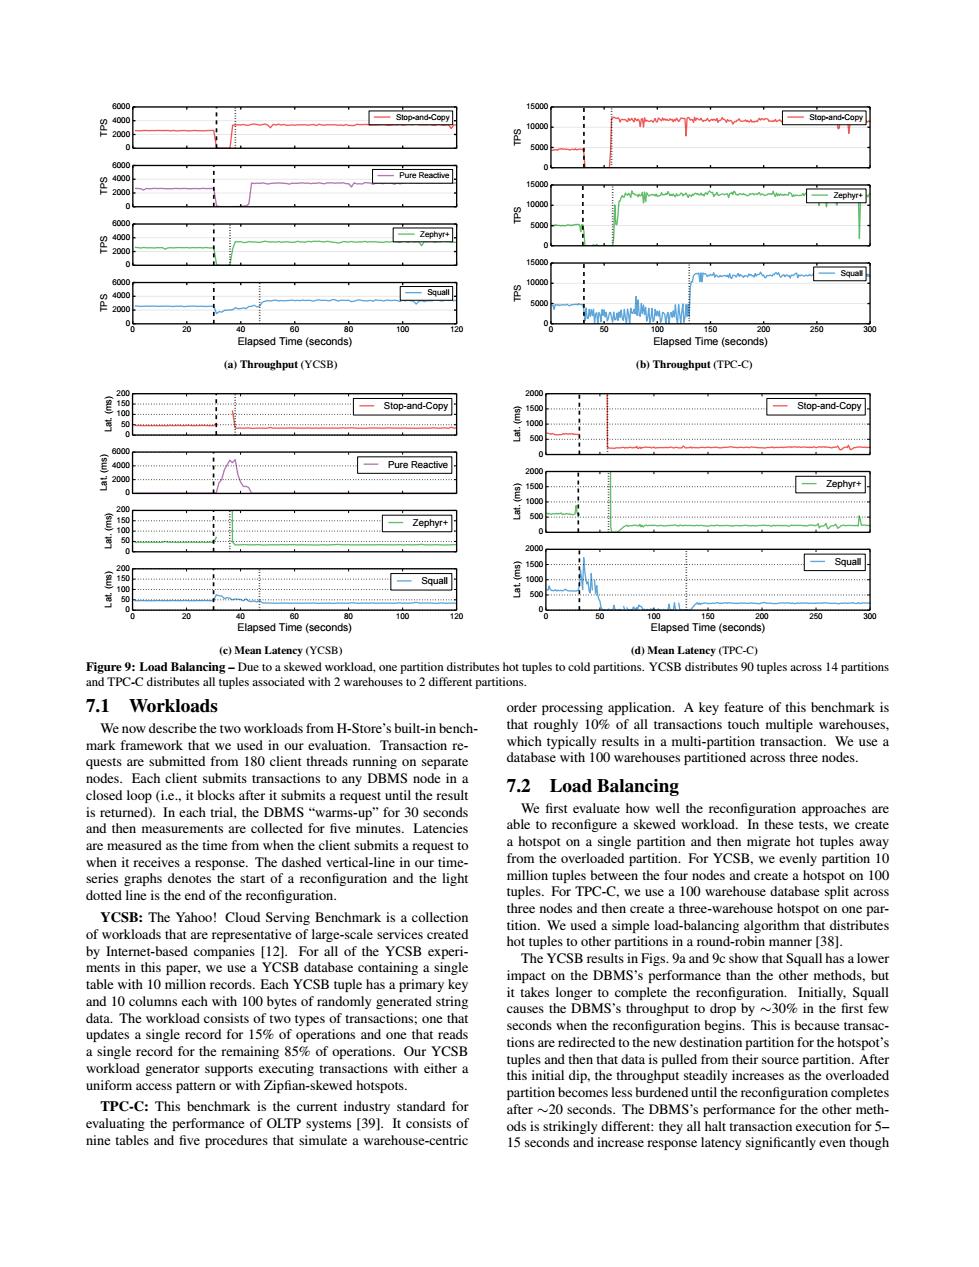
Sapp-and-Copy a)Th b)T ut (TPC-C 一2pr+ Elaosed Time (seconds) e)Mean Latensy (YCSB id)Mean Latensy (PC-C) 7.1 Workloads mark framew 7.2 Load Balancing and thn me partition and the rate hot tuples aw m10 lit ac YCSB:The Yahoo!Cloud Serving Benchmark is a collection ot workloads that are repre tition. d-aanc ing a singk The YCSB 10 colum mly ger rated string it takes longe olete the p cess pattern or with Zipfian-skewed hotspots. ases as the over uniform TPC-C:This The DBMS's performance for the other meth nine tables and five procedures that simulate a warehouse-centric 0 2000 4000 6000 TPS Stop-and-Copy 0 2000 4000 6000 TPS Pure Reactive 0 2000 4000 6000 TPS Zephyr+ 0 20 40 60 80 100 120 Elapsed Time (seconds) 0 2000 4000 6000 TPS Squall (a) Throughput (YCSB) 0 5000 10000 15000 TPS Stop-and-Copy 0 5000 10000 15000 TPS Zephyr+ 0 50 100 150 200 250 300 Elapsed Time (seconds) 0 5000 10000 15000 TPS Squall (b) Throughput (TPC-C) 0 50 100 150 200 Lat. (ms) Stop-and-Copy 0 2000 4000 6000 Lat. (ms) Pure Reactive 0 50 100 150 200 Lat. (ms) Zephyr+ 0 20 40 60 80 100 120 Elapsed Time (seconds) 0 50 100 150 200 Lat. (ms) Squall (c) Mean Latency (YCSB) 0 500 1000 1500 2000 Lat. (ms) Stop-and-Copy 0 500 1000 1500 2000 Lat. (ms) Zephyr+ 0 50 100 150 200 250 300 Elapsed Time (seconds) 0 500 1000 1500 2000 Lat. (ms) Squall (d) Mean Latency (TPC-C) Figure 9: Load Balancing – Due to a skewed workload, one partition distributes hot tuples to cold partitions. YCSB distributes 90 tuples across 14 partitions and TPC-C distributes all tuples associated with 2 warehouses to 2 different partitions. 7.1 Workloads We now describe the two workloads from H-Store’s built-in benchmark framework that we used in our evaluation. Transaction requests are submitted from 180 client threads running on separate nodes. Each client submits transactions to any DBMS node in a closed loop (i.e., it blocks after it submits a request until the result is returned). In each trial, the DBMS “warms-up” for 30 seconds and then measurements are collected for five minutes. Latencies are measured as the time from when the client submits a request to when it receives a response. The dashed vertical-line in our timeseries graphs denotes the start of a reconfiguration and the light dotted line is the end of the reconfiguration. YCSB: The Yahoo! Cloud Serving Benchmark is a collection of workloads that are representative of large-scale services created by Internet-based companies [12]. For all of the YCSB experiments in this paper, we use a YCSB database containing a single table with 10 million records. Each YCSB tuple has a primary key and 10 columns each with 100 bytes of randomly generated string data. The workload consists of two types of transactions; one that updates a single record for 15% of operations and one that reads a single record for the remaining 85% of operations. Our YCSB workload generator supports executing transactions with either a uniform access pattern or with Zipfian-skewed hotspots. TPC-C: This benchmark is the current industry standard for evaluating the performance of OLTP systems [39]. It consists of nine tables and five procedures that simulate a warehouse-centric order processing application. A key feature of this benchmark is that roughly 10% of all transactions touch multiple warehouses, which typically results in a multi-partition transaction. We use a database with 100 warehouses partitioned across three nodes. 7.2 Load Balancing We first evaluate how well the reconfiguration approaches are able to reconfigure a skewed workload. In these tests, we create a hotspot on a single partition and then migrate hot tuples away from the overloaded partition. For YCSB, we evenly partition 10 million tuples between the four nodes and create a hotspot on 100 tuples. For TPC-C, we use a 100 warehouse database split across three nodes and then create a three-warehouse hotspot on one partition. We used a simple load-balancing algorithm that distributes hot tuples to other partitions in a round-robin manner [38]. The YCSB results in Figs. 9a and 9c show that Squall has a lower impact on the DBMS’s performance than the other methods, but it takes longer to complete the reconfiguration. Initially, Squall causes the DBMS’s throughput to drop by ∼30% in the first few seconds when the reconfiguration begins. This is because transactions are redirected to the new destination partition for the hotspot’s tuples and then that data is pulled from their source partition. After this initial dip, the throughput steadily increases as the overloaded partition becomes less burdened until the reconfiguration completes after ∼20 seconds. The DBMS’s performance for the other methods is strikingly different: they all halt transaction execution for 5– 15 seconds and increase response latency significantly even though