正在加载图片...
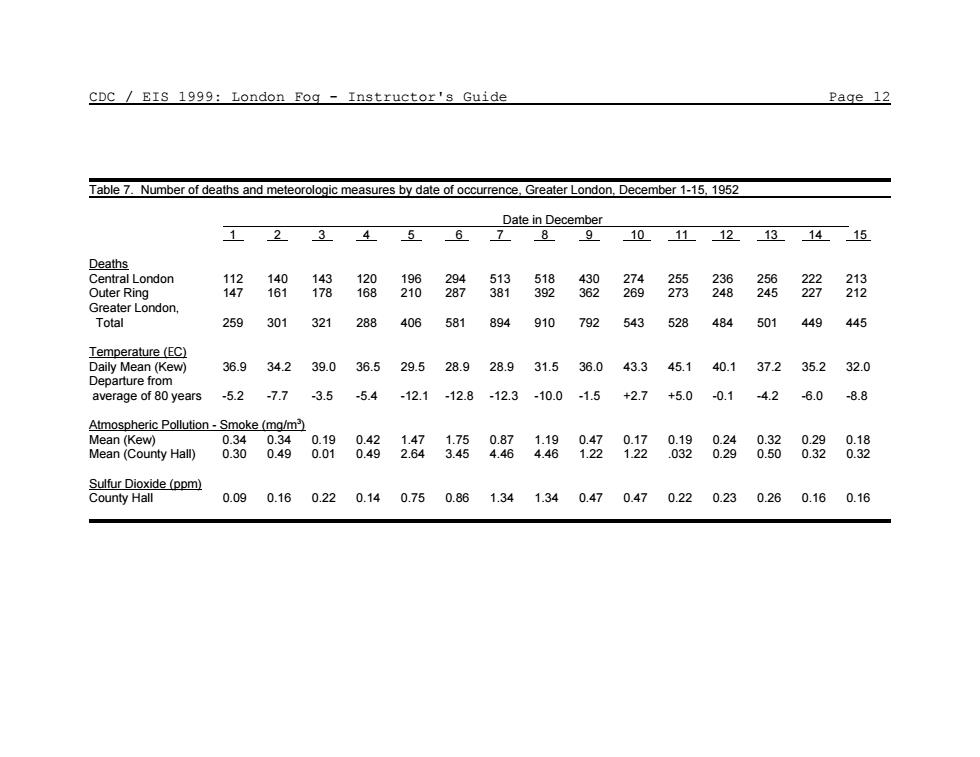
CDC EIS 1999:London Fog -Instructor's Guide Page 12 Table 7.Number of deaths and meteorologic measures by date of occurrence.Greater London,December 1-15,1952 1 2 34 101112131415 eat London Outer Ring 1168918889858598862源38838器219 London. 259301321288406581894910792543 528484501 449 445 Temperature(EC) 36.934239.036.529.528.928.931.536.043.345.140.137235.232.0 average of80 years5.27.73.55.4-12.112.8-12.3-10.015+2.7+5.00.14.2-6.08.8 880889888g489品盟龈828器8盟8盟 m 0.090.160.220.140.750.861.341.340.470.470.220.230.260.160.16CDC / EIS 1999: London Fog - Instructor's Guide Page 12 Table 7. Number of deaths and meteorologic measures by date of occurrence, Greater London, December 1-15, 1952 Date in December 1 2 3 4 5 6 7 8 9 10 11 12 13 14 15 Deaths Central London 112 140 143 120 196 294 513 518 430 274 255 236 256 222 213 Outer Ring 147 161 178 168 210 287 381 392 362 269 273 248 245 227 212 Greater London, Total 259 301 321 288 406 581 894 910 792 543 528 484 501 449 445 Temperature (EC) Daily Mean (Kew) 36.9 34.2 39.0 36.5 29.5 28.9 28.9 31.5 36.0 43.3 45.1 40.1 37.2 35.2 32.0 Departure from average of 80 years -5.2 -7.7 -3.5 -5.4 -12.1 -12.8 -12.3 -10.0 -1.5 +2.7 +5.0 -0.1 -4.2 -6.0 -8.8 Atmospheric Pollution - Smoke (mg/m3 ) Mean (Kew) 0.34 0.34 0.19 0.42 1.47 1.75 0.87 1.19 0.47 0.17 0.19 0.24 0.32 0.29 0.18 Mean (County Hall) 0.30 0.49 0.01 0.49 2.64 3.45 4.46 4.46 1.22 1.22 .032 0.29 0.50 0.32 0.32 Sulfur Dioxide (ppm) County Hall 0.09 0.16 0.22 0.14 0.75 0.86 1.34 1.34 0.47 0.47 0.22 0.23 0.26 0.16 0.16