
Centers for Disease Control and Prevention Epidemiology Program Office Case Studies in Applied Epidemiology No.751-N99 An Epidemic of Deaths in the London Fog Instructor's Guide case study,the participant should be able to: Construct and interpret graphs of time-related data; Calculate and discuss excess mortality: Discuss thestrengthnd limii of mortality data,and the interpretaion of morality external events;and Construct and interpret a scattergram. This case study was originally developed for the CDC EIS Summer Course by Malcolm Harrington EIS 'xx)in the 1970s. An a ersion was developed at the World Health Organization by and was adapted and revised py Ric U.S.DEPARTMENT OF HEALTH AND HUMAN SERVICES Public Health Service
Centers for Disease Control and Prevention Epidemiology Program Office Case Studies in Applied Epidemiology No. 751-N99 An Epidemic of Deaths in the London Fog Instructor's Guide Learning Objectives After completing this case study, the participant should be able to: G Construct and interpret graphs of time-related data; G Calculate and discuss excess mortality; G Discuss the strengths and limitations of mortality data, and the interpretation of mortality patterns in light of external events; and G Construct and interpret a scattergram. This case study was originally developed for the CDC EIS Summer Course by Malcolm Harrington (EIS 'xx) in the 1970s. An alternative version was developed at the World Health Organization by Todd Kjellström and Nancy Hicks in 1991. The current version contains features from both versions, and was adapted and revised by Richard Dicker in 1999. U.S. DEPARTMENT OF HEALTH AND HUMAN SERVICES Public Health Service

CDC/EIS,1999:London Fog-Instructor's Guide Page 2 PARTI Onthe moing Friday ecember. o Ambulanceby At the annual Smithfield Show.featuring prized and goats. fog was generally considered to be the worst in living memory. London is situated in the valley of the River The fog had far-reaching effects on city life 0amsadns8omhe9et5Relanc8aeae8mab8 Low visibility contributed to numerous traffic covers 720 square miles and is inhabited by8 dents million people by incre Question 1: Mh8gCnomane,mgmyou ect to determine the potential health impact Answer 1: Morbidity Data Hospital discharge data-usually available Hospital discharge data Coroner's records Parpea2neog80pmeaegoseysocok2c Environmental Data(to assess link between environmental factors and health) Daily temperature,wind Measures of air quality air pollution Question 2:Assuming that at least some of the data you want would be available for the current time period.what might you use for a comparison period? ely prec ding the time period of interest,or uring the previous year or years
CDC / EIS, 1999: London Fog - Instructor's Guide Page 2 PART I On the morning of Friday, December 5, 1952, with the temperature just below freezing, a dense fog settled over Greater London. The fog was notable for its density, its duration, and almost complete absence of remission in either density or temperature for four long days. The fog was generally considered to be the worst in living memory. The fog had far-reaching effects on city life. Low visibility contributed to numerous traffic accidents. Emergency services were taxed both by increased demand and poor driving conditions. Ambulance services were kept busy by an apparent increase in people suffering from a variety of illnesses, predominantly respiratory. At the annual Smithfield Show, featuring prized pigs, cows, sheep, and goats, a number of cows died. London is situated in the valley of the River Thames in southeast England, bounded on the north and south by chalk hills. Greater London covers 720 square miles and is inhabited by 8 million people. Question 1: What sources of data might you use to collect to determine the potential health impact of the fog on humans? Answer 1: Morbidity Data • Hospital discharge data - usually available • Clinics, emergency departments • School and employee absenteeism data Mortality Data • Death certificates • Hospital discharge data • Coroner's records Demographic Data (neccesary for providing denominators for rates) • Population by smallest geographic area possible, by age, sex, etc. Environmental Data (to assess link between environmental factors and health) • Daily temperature, wind • Measures of air quality / air pollution Question 2: Assuming that at least some of the data you want would be available for the current time period, what might you use for a comparison period? Answer 2 The two most common comparison time periods are: • the period immediately preceding the time period of interest, or • the comparable time period during the previous year or years
CDC/EIS,1999:London Fog-Instructor's Guide Page 3 Tables 1 and 2 show the number and rate of comparison,the number of deaths registered in deaths registered (received) the 160"Great Towns"outside of London are also shown Week Ending Area 118111151122112912612131220122713110 Central London 6937477538539452.4841.5231.0291.3721.216 Outer Ring 9008189461.0491,1172.2191,6151,2051,6051,418 Lnn 1,5931.5651.6991.9022.0624.7033,1382.2342.9772.634 ae8eatIasn 3,3103,4103,6034,1404,5854,7494,5414,2384,8654,983 Table 2.Deathr Nous per nuary Area 啦2逸2蓝”2亚返四 Central London 23.124.925.128.431.582.850.834.345.740.5 Outer Ring 18.016.418.921.022.344.432.324.132.128.4 Question 3:Graph and interpret the data in Tables 1 and 2. Answer 3 The number and rate of deaths registered in Central London increased sharply during the week baseline.Aseco d.sr maller peak occurred during the week ending January 3.Possible ations include late reporting of deaths during the holidays,or a true second wave of In contrast to the sharp peaks in Greater London.the weekly number of deaths in the 160 Great
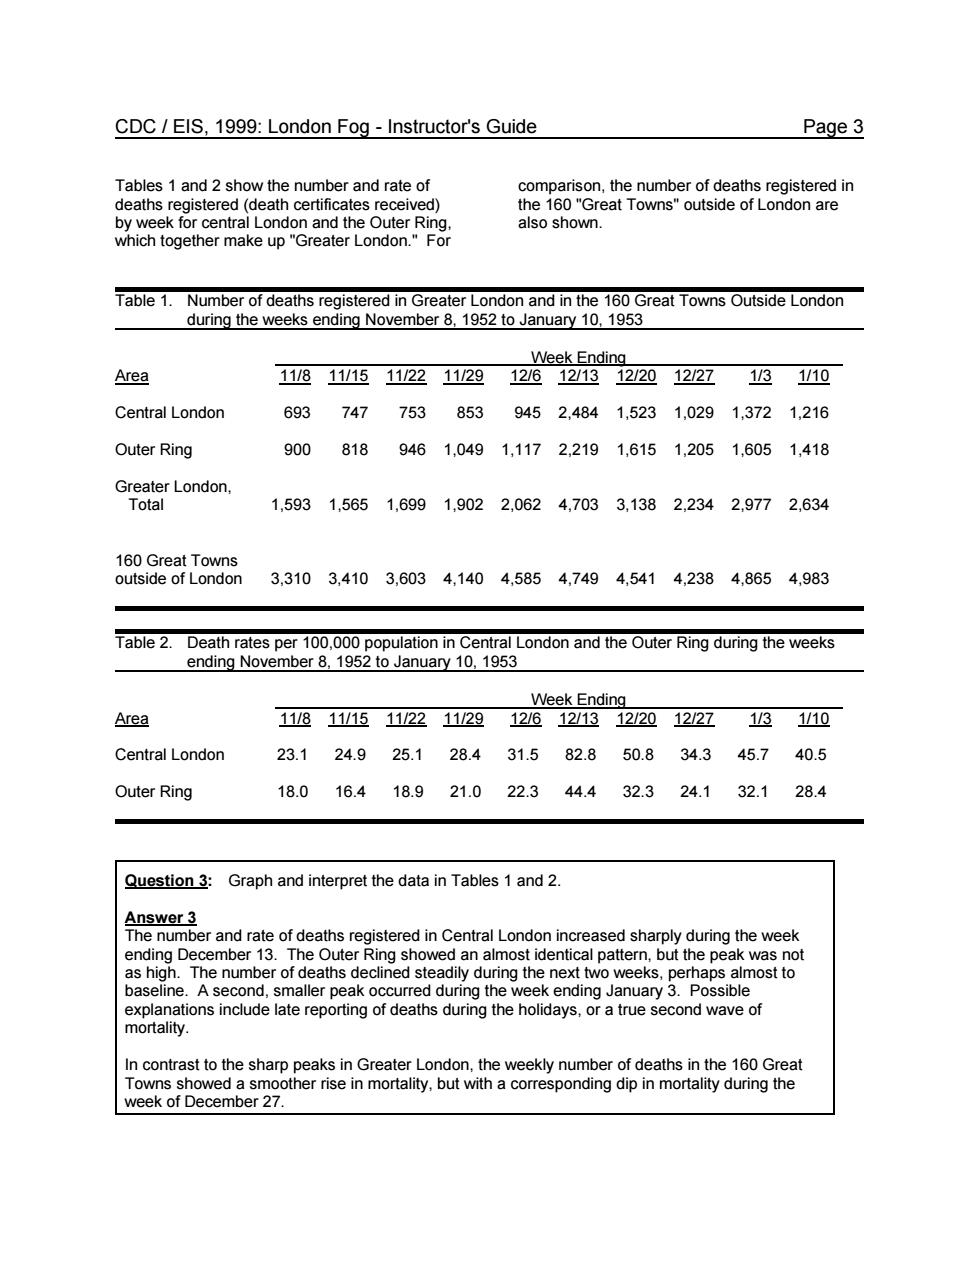
CDC / EIS, 1999: London Fog - Instructor's Guide Page 3 Tables 1 and 2 show the number and rate of deaths registered (death certificates received) by week for central London and the Outer Ring, which together make up "Greater London." For comparison, the number of deaths registered in the 160 "Great Towns" outside of London are also shown. Table 1. Number of deaths registered in Greater London and in the 160 Great Towns Outside London during the weeks ending November 8, 1952 to January 10, 1953 Week Ending Area 11/8 11/15 11/22 11/29 12/6 12/13 12/20 12/27 1/3 1/10 Central London 693 747 753 853 945 2,484 1,523 1,029 1,372 1,216 Outer Ring 900 818 946 1,049 1,117 2,219 1,615 1,205 1,605 1,418 Greater London, Total 1,593 1,565 1,699 1,902 2,062 4,703 3,138 2,234 2,977 2,634 160 Great Towns outside of London 3,310 3,410 3,603 4,140 4,585 4,749 4,541 4,238 4,865 4,983 Table 2. Death rates per 100,000 population in Central London and the Outer Ring during the weeks ending November 8, 1952 to January 10, 1953 Week Ending Area 11/8 11/15 11/22 11/29 12/6 12/13 12/20 12/27 1/3 1/10 Central London 23.1 24.9 25.1 28.4 31.5 82.8 50.8 34.3 45.7 40.5 Outer Ring 18.0 16.4 18.9 21.0 22.3 44.4 32.3 24.1 32.1 28.4 Question 3: Graph and interpret the data in Tables 1 and 2. Answer 3 The number and rate of deaths registered in Central London increased sharply during the week ending December 13. The Outer Ring showed an almost identical pattern, but the peak was not as high. The number of deaths declined steadily during the next two weeks, perhaps almost to baseline. A second, smaller peak occurred during the week ending January 3. Possible explanations include late reporting of deaths during the holidays, or a true second wave of mortality. In contrast to the sharp peaks in Greater London, the weekly number of deaths in the 160 Great Towns showed a smoother rise in mortality, but with a corresponding dip in mortality during the week of December 27

CDC/EIS,1999:London Fog-Instructor's Guide Page4 6000 5000 ◆ 4000 300 号2000 1000 200 10-Ja Deaths ◆-Central London-Outer Ring◆-16 0 Towns Death rate in Central London and Outer Ring for weeks onding Nov.8,1952-Jan.10.953 40d 20.0 8-No 20-Nov 200a 270e 3-Jan 。-Central London■-Outer Ring
CDC / EIS, 1999: London Fog - Instructor's Guide Page 4 Deaths in Greater London and 160 Towns by week ending Nov. 8 1952 - Jan. 10, 1953 0 1000 2000 3000 4000 5000 6000 8-Nov 15-Nov 22-Nov 29-Nov 6-Dec 13-Dec 20-Dec 27-Dec 3-Jan 10-Jan Deaths Week ending Central London Outer Ring 160 Tow ns Death rate in Central London and Outer Ring for weeks ending Nov. 8, 1952 - Jan. 10,953 0.0 10.0 20.0 30.0 40.0 50.0 60.0 70.0 80.0 90.0 8-Nov 15-Nov 22-Nov 29-Nov 6-Dec 13-Dec 20-Dec 27-Dec 3-Jan 10-Jan Week ending Death rate per 100,000 Central London Outer Ring
CDC/EIS,1999:London Fog-Instructor's Guide Page 5 The number of deaths registered in Greater Lond the we ending Nov 8.1952 ding weeks for the previous v shown in Table 3. through Jan.10.193 and for the Table 3.Number of registered deaths,Greater London,weeks ending November 8,1952 to January 10, 1953,and in the corresponding weeks of the previous five years Week Ending Year 111811151122112912612/131220122713 1/10 1947-48 1,6161,5451.6831.5661.7951,7631,74914532,0281,740 1948-49 1,6881,7581,8091,6372.2062.0671,8101.6242,1812,170 1949-50 1,9071.9532,0022.0861.8801,8021,8581,8581,8051,958 1950-51 1,7921,7471,7221,8811,8191,9792,3202,4143,4153,297 1951-52 1,7251,6311,4121,5131,5431,8522,0211,7631,9462,029 1952-53 1.5931,5651.6991.9022.0624,7033.1382.2342.9772.634 Average. 1947-51 1,7461,7271,7261,7371,8491,8931.9521.8222,2752,239 Question 4:How does the mortality pattern in 1952/1953 compare with the historical patterns? Answer 4 See attached graph Large excess in number of deaths,especially for the weeks ending 12/13 and 12/20. Instructor's Note The excess during19-1949 week ending 16 was attributed toFOG. he excess during 1950-1951 the last four weeks was attributed to INFLUENZA:
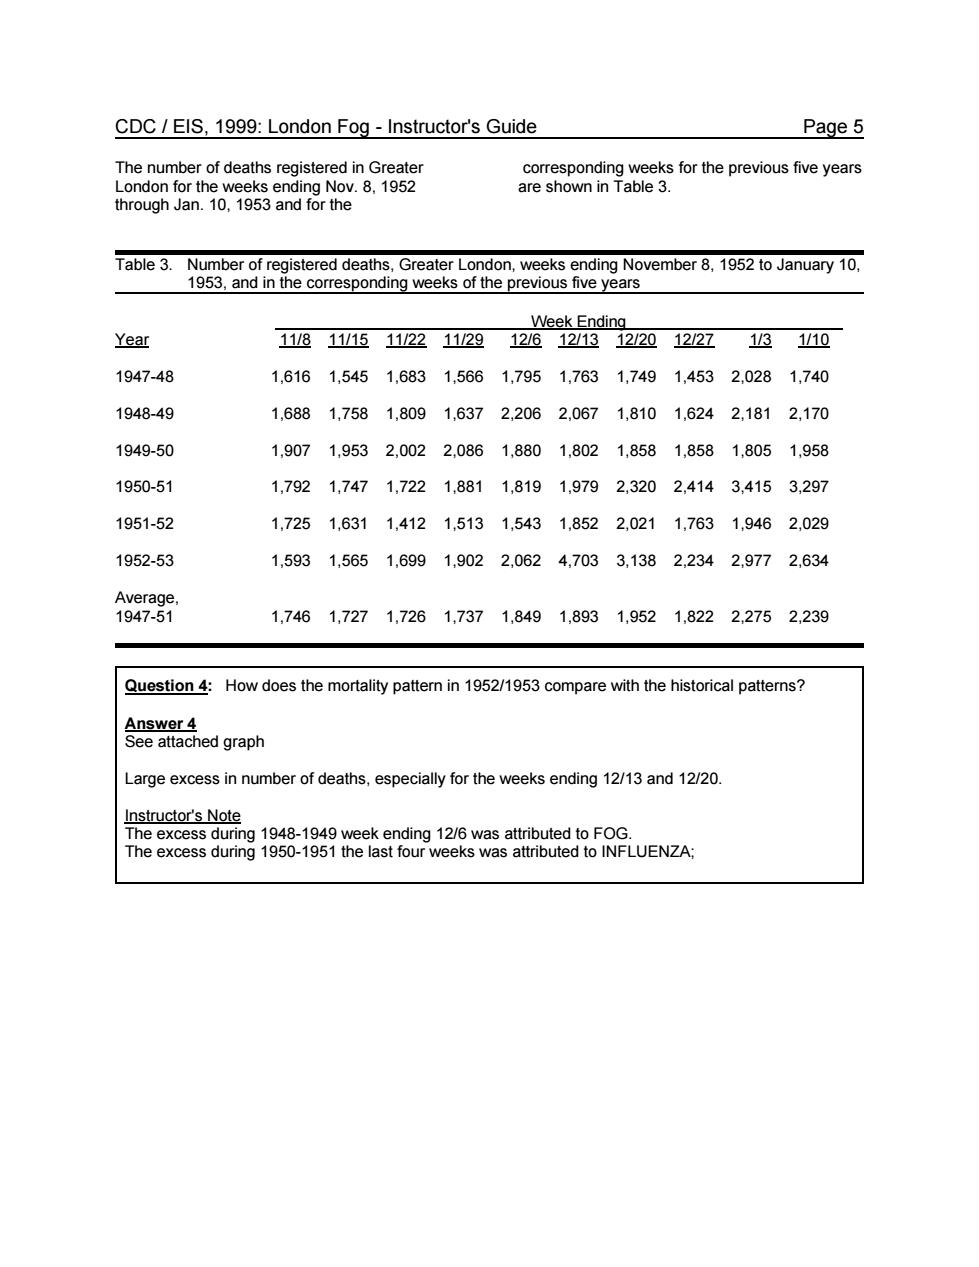
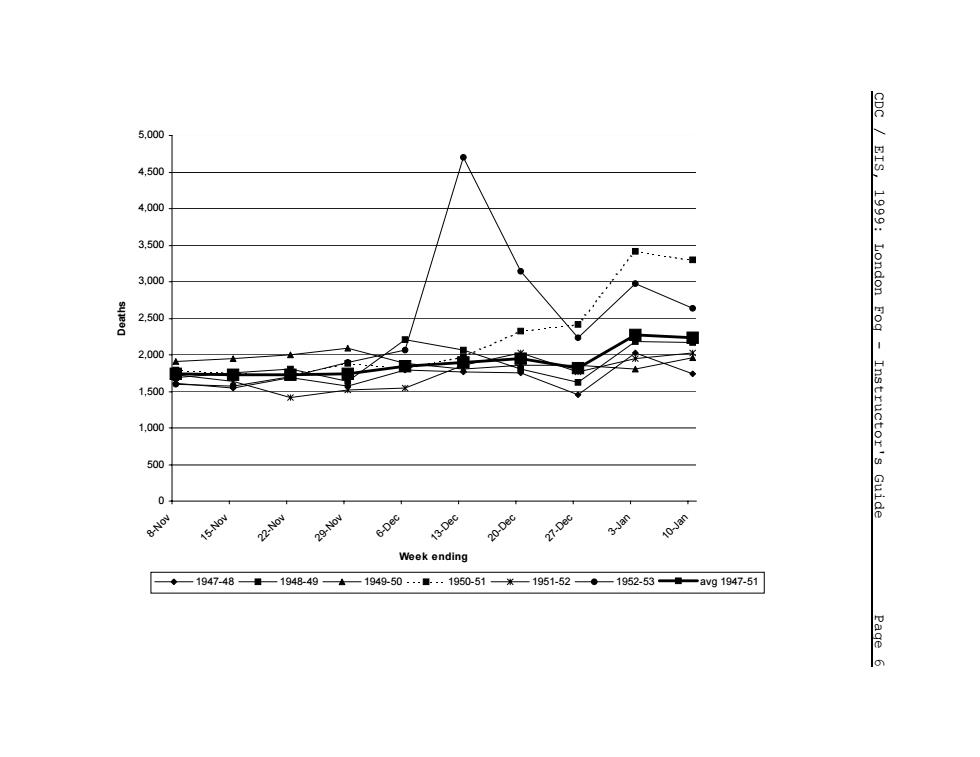
CDC / EIS, 1999: London Fog - Instructor's Guide Page 5 The number of deaths registered in Greater London for the weeks ending Nov. 8, 1952 through Jan. 10, 1953 and for the corresponding weeks for the previous five years are shown in Table 3. Table 3. Number of registered deaths, Greater London, weeks ending November 8, 1952 to January 10, 1953, and in the corresponding weeks of the previous five years Week Ending Year 11/8 11/15 11/22 11/29 12/6 12/13 12/20 12/27 1/3 1/10 1947-48 1,616 1,545 1,683 1,566 1,795 1,763 1,749 1,453 2,028 1,740 1948-49 1,688 1,758 1,809 1,637 2,206 2,067 1,810 1,624 2,181 2,170 1949-50 1,907 1,953 2,002 2,086 1,880 1,802 1,858 1,858 1,805 1,958 1950-51 1,792 1,747 1,722 1,881 1,819 1,979 2,320 2,414 3,415 3,297 1951-52 1,725 1,631 1,412 1,513 1,543 1,852 2,021 1,763 1,946 2,029 1952-53 1,593 1,565 1,699 1,902 2,062 4,703 3,138 2,234 2,977 2,634 Average, 1947-51 1,746 1,727 1,726 1,737 1,849 1,893 1,952 1,822 2,275 2,239 Question 4: How does the mortality pattern in 1952/1953 compare with the historical patterns? Answer 4 See attached graph Large excess in number of deaths, especially for the weeks ending 12/13 and 12/20. Instructor's Note The excess during 1948-1949 week ending 12/6 was attributed to FOG. The excess during 1950-1951 the last four weeks was attributed to INFLUENZA;
5.0 4500 350 3.00 London 2,500 2.00d ,50 ,00 0 Veek ending ◆—1947-48量-1948-49 1949-50-量1950-51米-1951-52◆—1952-53avg1947-51
0 500 1,000 1,500 2,000 2,500 3,000 3,500 4,000 4,500 5,000 8-Nov 15-Nov 22-Nov 29-Nov 6-Dec 13-Dec 20-Dec 27-Dec 3-Jan 10-Jan Week ending Deaths 1947-48 1948-49 1949-50 1950-51 1951-52 1952-53 avg 1947-51 CDC / EIS, 1999: London Fog - Instructor's Guide Page 6

CDC EIS,1999:London Fog-Instructor's Guide Page 7 Question 5:Estimate the number of excess deaths in 1952/1953. est method for calculating excess mortality is to specify the period of interest.then subtract the expected number of deaths from the observed number of deaths for each week,and sum up. nude the excess deaths tor the weeks ending Nov.2 and Dec.6.since they are The steps are as follows 1.First.calculatexpecumber of deaths for each week.In this setting,use the mean number of de tieaegomR6ra6isicano0ie1setngs,heepectednumber 4 Calculate the upper from the upper limit to get calculate the exc te upper ct the observed number of deaths Add the excess deaths for the entire time period Excess above standard 5-yr mean Excess Week ending 1952/1953 5-year mean 5-yr mean on SL above 2 SD Noy 15 727 154 2 Nov.22 1,699 1,726 ,154 29 4.703 1.893 2.81 2.556 1. 728 Jan.3 2977 2275 Jan.10 2.634 2,239 612 395 3.463 TOTAL EXCESS: 5.505 3,284 What are some pos ible expla for ee ortality in 1952-1953? Answer 6 include e contained in the fog(air pollutant) nts agent introduced by animals or fa hers participating in the Smithfield Show other e.g
CDC / EIS, 1999: London Fog - Instructor's Guide Page 7 Question 5: Estimate the number of excess deaths in 1952/1953. Answer 5 The simplest method for calculating excess mortality is to specify the period of interest, then subtract the expected number of deaths from the observed number of deaths for each week, and sum up. (You would not include the excess deaths for the weeks ending Nov. 29 and Dec. 6, since they are “pre-epidemic”.) A second method, more complicated but more scientifically rigorous, is to compute excess mortality as the number of deaths that exceed the upper 95% confidence limit for expected deaths for a given week. The steps are as follows: 1. First, calculate the expected number of deaths for each week. In this setting, use the mean number of deaths for that week, based on previous years. In other settings, the expected number may be based on a more complicated formula or a statistical model. 2. Calculate the standard deviation. 3. Calculate the upper 95% confidence limit as the mean + 2 standard deviations. 4. If the observed number of deaths exceeds the upper limit, subtract the observed number of deaths from the upper limit to get calculate the excess. 5. Add the excess deaths for the entire time period. Excess above standard 5-yr mean Excess Week ending 1952/1953 5-year mean 5-yr mean deviation + 2 SD above 2 SD Nov. 8 1,593 1,746 — 110 1,966 — Nov. 15 1,565 1,727 — 154 2,035 — Nov. 22 1,699 1,726 — 214 2,154 — Nov. 29 1,902 1,737 [165] 241 2,219 — Dec. 6 2,062 1,849 [213] 238 2,325 — Dec. 13 4,703 1,893 2,810 127 2,147 2,556 Dec. 20 3,138 1,952 1,186 229 2,410 728 Dec. 27 2,234 1,822 412 364 2,550 — Jan. 3 2,977 2,275 702 652 3,579 — Jan. 10 2,634 2,239 612 395 3,463 — TOTAL EXCESS: 5,505 3,284 Question 6: What are some possible explanations for the excess mortality in 1952-1953? Answer 6 Possibilities include: • a substance contained in the fog (air pollutant) • influenza • traffic accidents • zoonosis - e.g., an agent introduced by animals or farmers participating in the Smithfield Show • other

CDC/EIS,1999:London Fog-Instructor's Guide Page 8 Table 4.Number of registered deaths bye groupCentral London.during the weeks ending ovember 8,1952 to January 10. Week Endinc Age group 11811/1511221129 1261213 12201227 1返 110 0-4 weeks 25 22 4 wks.-1 yr 8 -4 yrs. 19151364 2257 6 3:4e 557631512173 6386016 441体351 95337261804 67 16第60份 28204179 27148份 39281020 95 years 60 544159090547 All Ages 693 747 753 853 9452.48415231.029 1.3721.216 Table 5.Death re November 8 group.Central London,during the weeks ending Age group 118 11/15 1122 1129 1216 12/13 1220 1227 110 558 623 6 110 98 14 yrs. yrs All Ages 20.7 22.3 22.5 25.5 28.2 74.2 45.5 30.7 41.0 36.3
CDC / EIS, 1999: London Fog - Instructor's Guide Page 8 Table 4 shows the number of registered deaths by age group. Table 5 shows the corresponding rates. Table 6 shows the number of registered death by cause of death. Table 4. Number of registered deaths by age group, Central London, during the weeks ending November 8, 1952 to January 10, 1953 Week Ending Age group 11/8 11/15 11/22 11/29 12/6 12/13 12/20 12/27 1/3 1/10 0 - 4 weeks 19 25 13 22 16 28 19 12 22 21 4 wks. - 1 yr 12 7 5 9 12 26 15 11 25 18 1 - 4 yrs. 5 5 11 5 6 7 13 7 7 5 5 - 14 yrs. 5 4 4 3 4 6 6 2 3 4 15 - 24 yrs. 7 12 4 3 9 7 14 7 9 4 25 - 34 yrs. 8 16 14 7 16 28 17 11 21 15 35 - 44 yrs. 33 21 28 22 36 64 29 34 28 39 45 - 54 yrs. 67 66 85 61 80 204 96 83 105 98 55 - 64 yrs. 123 138 118 152 157 448 251 167 236 204 65 - 74 yrs. 177 210 229 226 254 717 444 258 368 334 75+ years 237 243 242 343 355 949 619 437 548 474 All Ages 693 747 753 853 945 2,484 1,523 1,029 1,372 1,216 Table 5. Death rates per 100,000 population by age group, Central London, during the weeks ending November 8, 1952 to January 10, 1953 Week Ending Age group 11/8 11/15 11/22 11/29 12/6 12/13 12/20 12/27 1/3 1/10 0 - 1 yrs. 55.0 65.2 36.7 63.2 57.1 110.0 69.3 46.9 95.8 79.5 1 - 4 yrs. 2.3 2.3 5.0 2.3 2.7 3.2 5.9 3.2 3.2 2.3 5 - 14 yrs. 1.3 1.0 1.0 0.8 1.0 1.6 1.6 0.5 0.8 1.0 15 - 24 yrs. 1.7 2.9 1.0 0.7 2.2 1.7 3.4 1.7 2.2 1.0 25 - 34 yrs. 1.4 2.9 2.5 1.3 2.9 5.0 3.0 2.0 3.7 2.7 35 - 44 yrs. 6.1 3.9 5.2 4.1 6.7 11.9 5.4 6.3 5.2 7.2 45 - 54 yrs. 15.0 14.8 19.0 13.7 17.9 45.7 21.5 18.6 23.5 22.0 55 - 64 yrs. 34.8 39.1 33.4 43.0 44.4 126.8 71.1 47.3 66.8 57.8 65 - 74 yrs. 70.0 83.1 90.6 89.4 100.5 283.6 175.6 102.0 145.5 132.1 75+ years 197.6 202.6 201.8 286.0 296.0 791.2 516.0 364.3 456.9 395.2 All Ages 20.7 22.3 22.5 25.5 28.2 74.2 45.5 30.7 41.0 36.3
CDC EIS,1999:London Fog-Instructor's Guide Page 9 Week Ending Cause of death 118111511221129126121312201227131i10 10201819147737 21 24 正 Cancer of stomach 20 31 22 20 30 21 18 23 30 30 Cancer of lung 41 30 38 27 45 69 32 36 8 36 Other malignant and lymphatic neoplasms 112114110113116 167118 91 133 109 CNS vascular lesions 49 84 73 98 102 128 119 91 131 105 anGstenaic ease 18 10 17 20 18 57 27 15 22 28 Coronary disease 93108 113131 118 281 152 10g 150128 59 65 65 79 88 244 131 108 136 115 28 28 30 42 126 80 40 50 44 Influenza 0 1 7 2 6 7 Pneumonia 35 293128 45 168 125 91 104 87 Bronchitis 39 45 46 73 16 704 396 184 215 222 Other disease of respiratory system 2510895221 13 10 14 Motor vehicle accidents 68618410 4 5 7 Suicide 5 5 5510 10 1 5 12 15 Other and ill- defined causes 176165168182215352241192298247 TOTAL(All causes) 6937477538539452.4841.5231,0291,3721,216
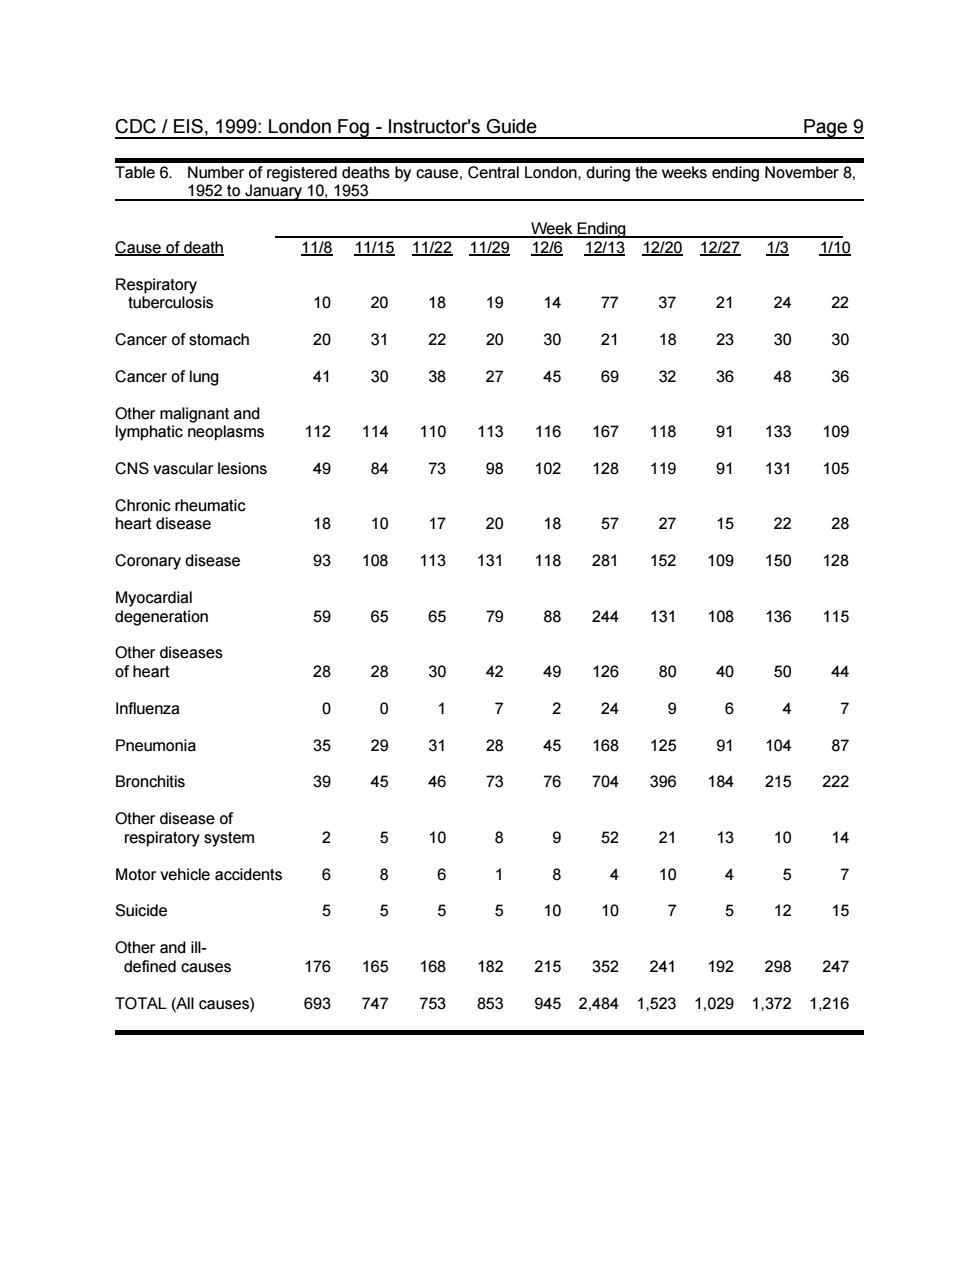
CDC / EIS, 1999: London Fog - Instructor's Guide Page 9 Table 6. Number of registered deaths by cause, Central London, during the weeks ending November 8, 1952 to January 10, 1953 Week Ending Cause of death 11/8 11/15 11/22 11/29 12/6 12/13 12/20 12/27 1/3 1/10 Respiratory tuberculosis 10 20 18 19 14 77 37 21 24 22 Cancer of stomach 20 31 22 20 30 21 18 23 30 30 Cancer of lung 41 30 38 27 45 69 32 36 48 36 Other malignant and lymphatic neoplasms 112 114 110 113 116 167 118 91 133 109 CNS vascular lesions 49 84 73 98 102 128 119 91 131 105 Chronic rheumatic heart disease 18 10 17 20 18 57 27 15 22 28 Coronary disease 93 108 113 131 118 281 152 109 150 128 Myocardial degeneration 59 65 65 79 88 244 131 108 136 115 Other diseases of heart 28 28 30 42 49 126 80 40 50 44 Influenza 0 0 1 7 2 24 9 6 4 7 Pneumonia 35 29 31 28 45 168 125 91 104 87 Bronchitis 39 45 46 73 76 704 396 184 215 222 Other disease of respiratory system 2 5 10 8 9 52 21 13 10 14 Motor vehicle accidents 6 8 6 1 8 4 10 4 5 7 Suicide 5 5 5 5 10 10 7 5 12 15 Other and ill- defined causes 176 165 168 182 215 352 241 192 298 247 TOTAL (All causes) 693 747 753 853 945 2,484 1,523 1,029 1,372 1,216

CDC/EIS,1999:London Fog-Instructor's Guide Page 10 Question 7:Describe the age-specific mortality data shown in Tables 4 and 5. Answer 7 in the oldest age Dec.13.morta eas8m729eakueeacning aeourng the wek oo2 During the weekd ing week,mortality for persons less than 45 years dropped to Dec.6 levels,but rates remained high for older age groups. Older age groups contributed most to the absolute increase in numbers;relative increase nil for 1-24 year age group.about 1.5-fold for infants,and about 2.5-fold for 55+. Question 8:Describe the cause-specific mortality data shown in Table 6. Answer 8 tratoa 283%of all deatins during the week ending Dec.13!Cardiovascular diseases also showed ath crea. oth ed ses(cancer.et al.)showed smaller increases.Motor Question 9:How might you evaluate the hypothesis that the increase in deaths is associated with the fog? Answer 9 One strategy would be to demonstrate a correlation by time and place,if possible.between health effects and one or mo
CDC / EIS, 1999: London Fog - Instructor's Guide Page 10 Question 7: Describe the age-specific mortality data shown in Tables 4 and 5. Answer 7 A small rise in the oldest age group is seen during the week of Nov. 29. During the week ending Dec. 13, mortality increases for infants and older age groups (no increase in 1-24 year olds), reaching 2.5 times the Dec. 6 level in 45+ groups. In the following week, mortality for persons less than 45 years dropped to Dec. 6 levels, but rates remained high for older age groups. Older age groups contributed most to the absolute increase in numbers; relative increase nil for 1-24 year age group, about 1.5-fold for infants, and about 2.5-fold for 55+. Question 8: Describe the cause-specific mortality data shown in Table 6. Answer 8 During the week ending Dec. 13, respiratory diseases, especially bronchitis, demonstrated the largest increases. As a proportion of all deaths, bronchitis rose from 5.6%-6.1% for the first 3 weeks shown to 28.3% of all deatlhs during the week ending Dec. 13! Cardiovascular diseases also showed substantial increases, while other chronic diseases (cancer, et al.) showed smaller increases. Motor vehicle deaths were not substantially increased. Question 9: How might you evaluate the hypothesis that the increase in deaths is associated with the fog? Answer 9 One strategy would be to demonstrate a correlation by time and place, if possible, between health effects and one or more measures of atmospheric conditions. These would certainly include temperature measures, but also air quality data