正在加载图片...
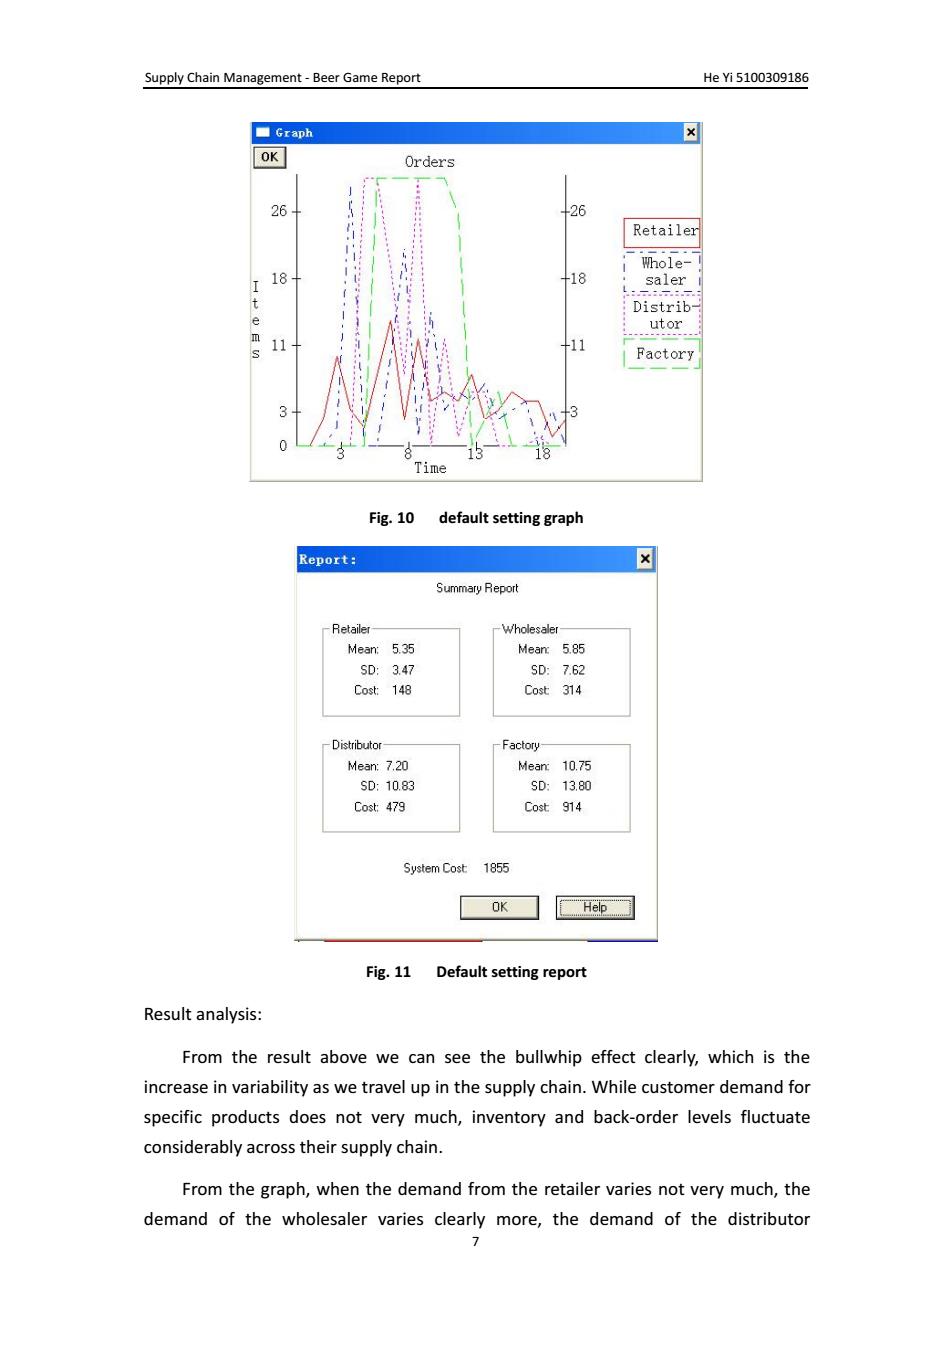
Supply Chain Management-Beer Game Report HeYi5100309186 ■Graph ☒ OK Orders 26 26 Retailer Whole- T 18 +18 saler Distrib utor 11 +11 Factory 0 8 Time Fig.10 default setting graph Report: Summary Report -Retailer -Wholesaler- Mean:5.35 Mean:5.85 SD:3.47 SD:7.62 Cost:148 Cost 314 Distributor- -Factory- Mean:7.20 Mean:10.75 SD:10.83 SD:13.80 Cost:479 Cost:914 System Cost 1855 OK E Help] Fig.11 Default setting report Result analysis: From the result above we can see the bullwhip effect clearly,which is the increase in variability as we travel up in the supply chain.While customer demand for specific products does not very much,inventory and back-order levels fluctuate considerably across their supply chain. From the graph,when the demand from the retailer varies not very much,the demand of the wholesaler varies clearly more,the demand of the distributor 7Supply Chain Management - Beer Game Report He Yi 5100309186 7 Fig. 10 default setting graph Fig. 11 Default setting report Result analysis: From the result above we can see the bullwhip effect clearly, which is the increase in variability as we travel up in the supply chain. While customer demand for specific products does not very much, inventory and back-order levels fluctuate considerably across their supply chain. From the graph, when the demand from the retailer varies not very much, the demand of the wholesaler varies clearly more, the demand of the distributor