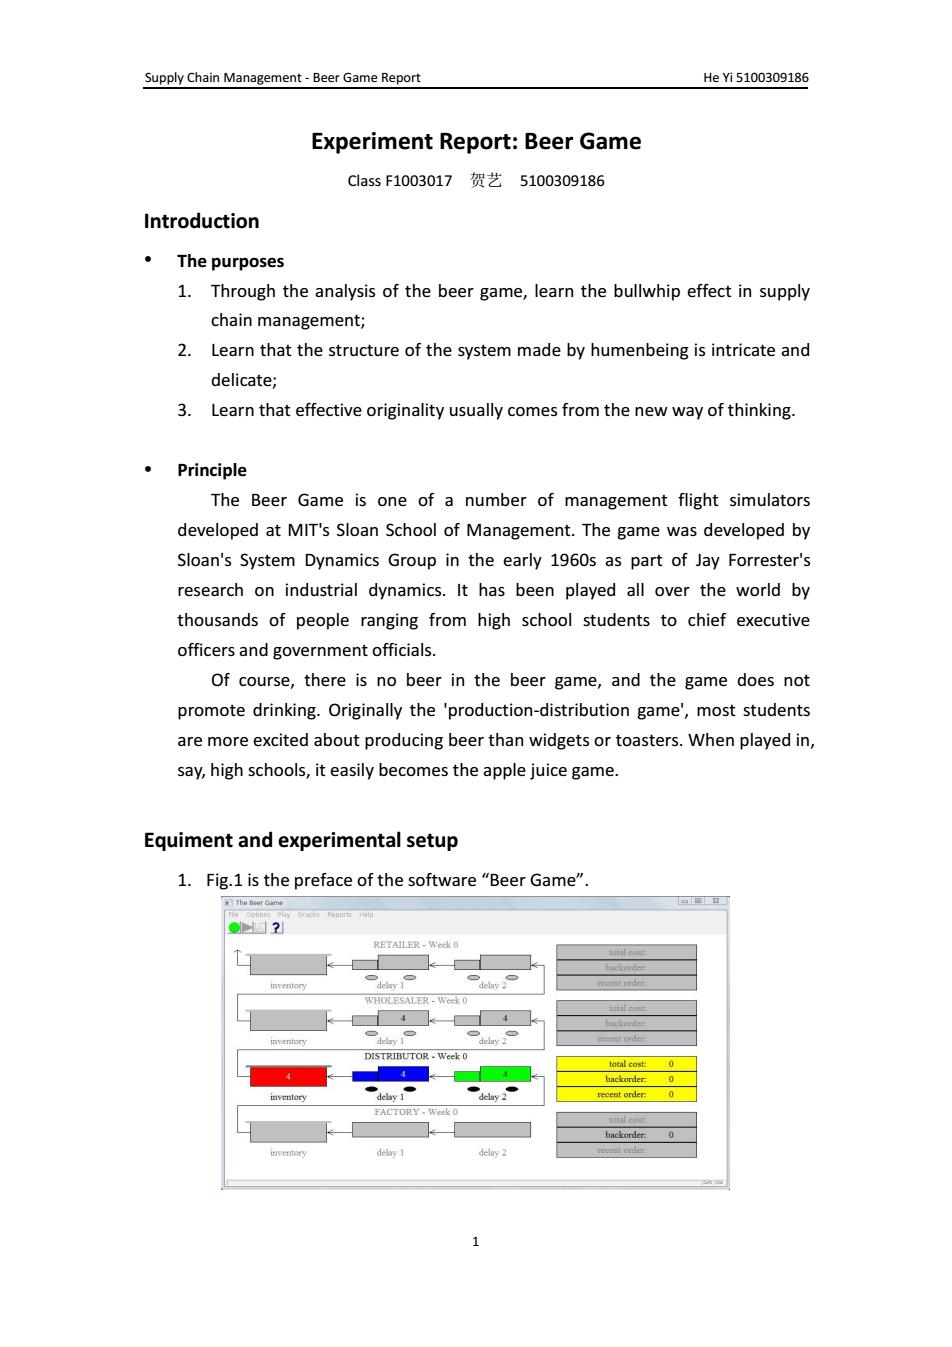
Supply Chain Management-Beer Game Report HeYi5100309186 Experiment Report:Beer Game Class F1003017贺艺5100309186 Introduction The purposes 1.Through the analysis of the beer game,learn the bullwhip effect in supply chain management; 2.Learn that the structure of the system made by humenbeing is intricate and delicate; 3.Learn that effective originality usually comes from the new way of thinking. ·Principle The Beer Game is one of a number of management flight simulators developed at MIT's Sloan School of Management.The game was developed by Sloan's System Dynamics Group in the early 1960s as part of Jay Forrester's research on industrial dynamics.It has been played all over the world by thousands of people ranging from high school students to chief executive officers and government officials. Of course,there is no beer in the beer game,and the game does not promote drinking.Originally the 'production-distribution game',most students are more excited about producing beer than widgets or toasters.When played in, say,high schools,it easily becomes the apple juice game. Equiment and experimental setup 1.Fig.1 is the preface of the software "Beer Game". 了 ●g2 RETAILER-Week 0 huclcorder inventory reet otder WHOLESALER Week 0 4 4 lclcorder inventary eceat order DISTRIBUTOR-Week 0 4 total cost 0 4 backorder:0 inventory dehy2 recent order:0 FACTORY.Week 0 backorder:0 delay2 tecent otder
Supply Chain Management - Beer Game Report He Yi 5100309186 1 Experiment Report: Beer Game Class F1003017 贺艺 5100309186 Introduction The purposes 1. Through the analysis of the beer game, learn the bullwhip effect in supply chain management; 2. Learn that the structure of the system made by humenbeing is intricate and delicate; 3. Learn that effective originality usually comes from the new way of thinking. Principle The Beer Game is one of a number of management flight simulators developed at MIT's Sloan School of Management. The game was developed by Sloan's System Dynamics Group in the early 1960s as part of Jay Forrester's research on industrial dynamics. It has been played all over the world by thousands of people ranging from high school students to chief executive officers and government officials. Of course, there is no beer in the beer game, and the game does not promote drinking. Originally the 'production-distribution game', most students are more excited about producing beer than widgets or toasters. When played in, say, high schools, it easily becomes the apple juice game. Equiment and experimental setup 1. Fig.1 is the preface of the software “Beer Game
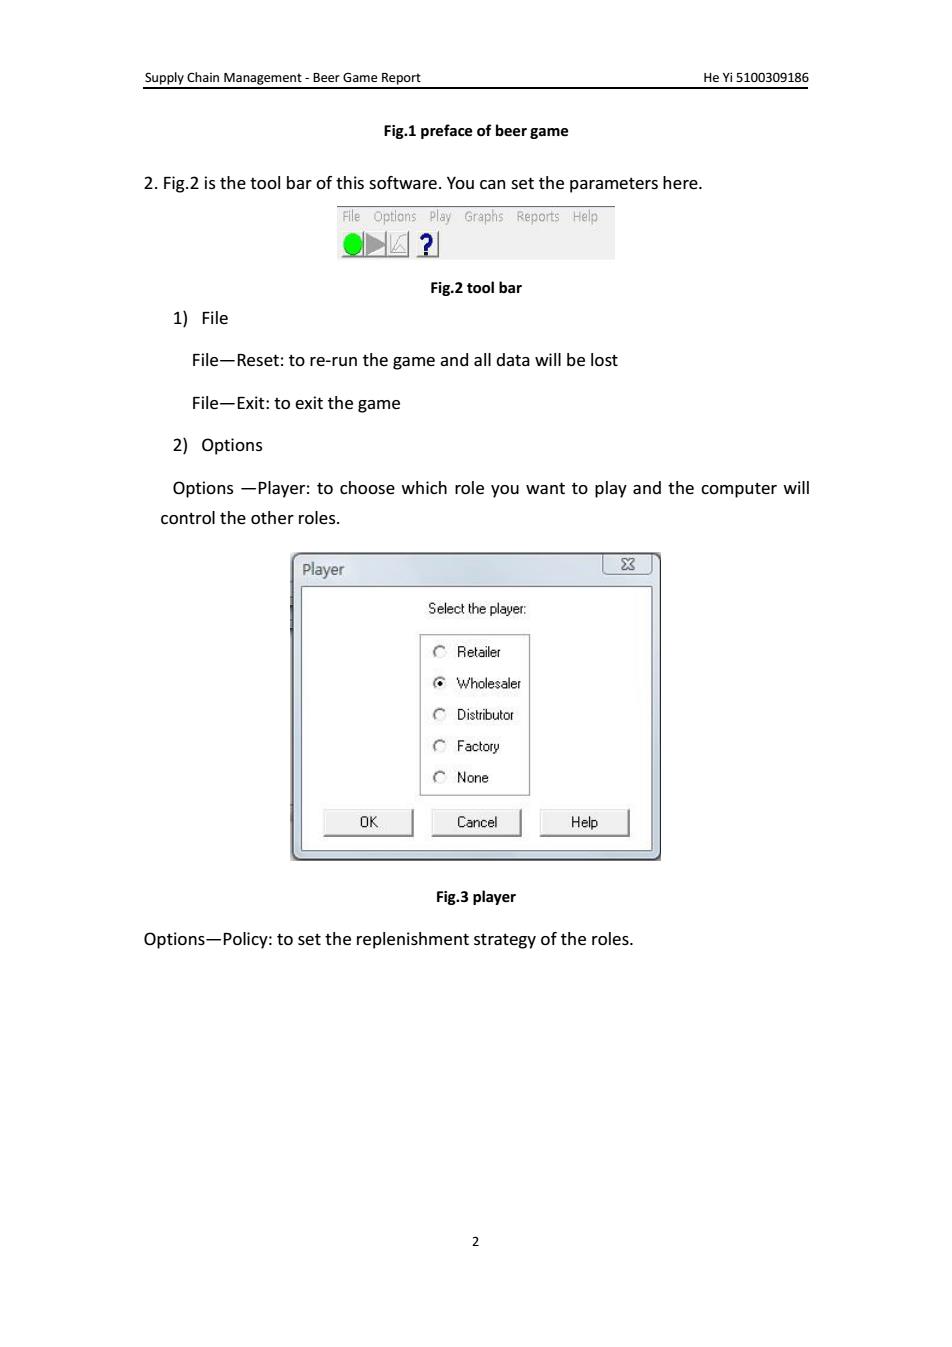
Supply Chain Management-Beer Game Report HeYi5100309186 Fig.1 preface of beer game 2.Fig.2 is the tool bar of this software.You can set the parameters here. File Options Play Graphs Reports Help @2 Fig.2 tool bar 1)File File-Reset:to re-run the game and all data will be lost File-Exit:to exit the game 2)Options Options-Player:to choose which role you want to play and the computer will control the other roles. player Select the player: CRetailer Wholesaler CDistributor CFactory C None OK Cancel Help Fig.3 player Options-Policy:to set the replenishment strategy of the roles
Supply Chain Management - Beer Game Report He Yi 5100309186 2 Fig.1 preface of beer game 2. Fig.2 is the tool bar of this software. You can set the parameters here. Fig.2 tool bar 1) File File—Reset: to re-run the game and all data will be lost File—Exit: to exit the game 2) Options Options —Player: to choose which role you want to play and the computer will control the other roles. Fig.3 player Options—Policy: to set the replenishment strategy of the roles
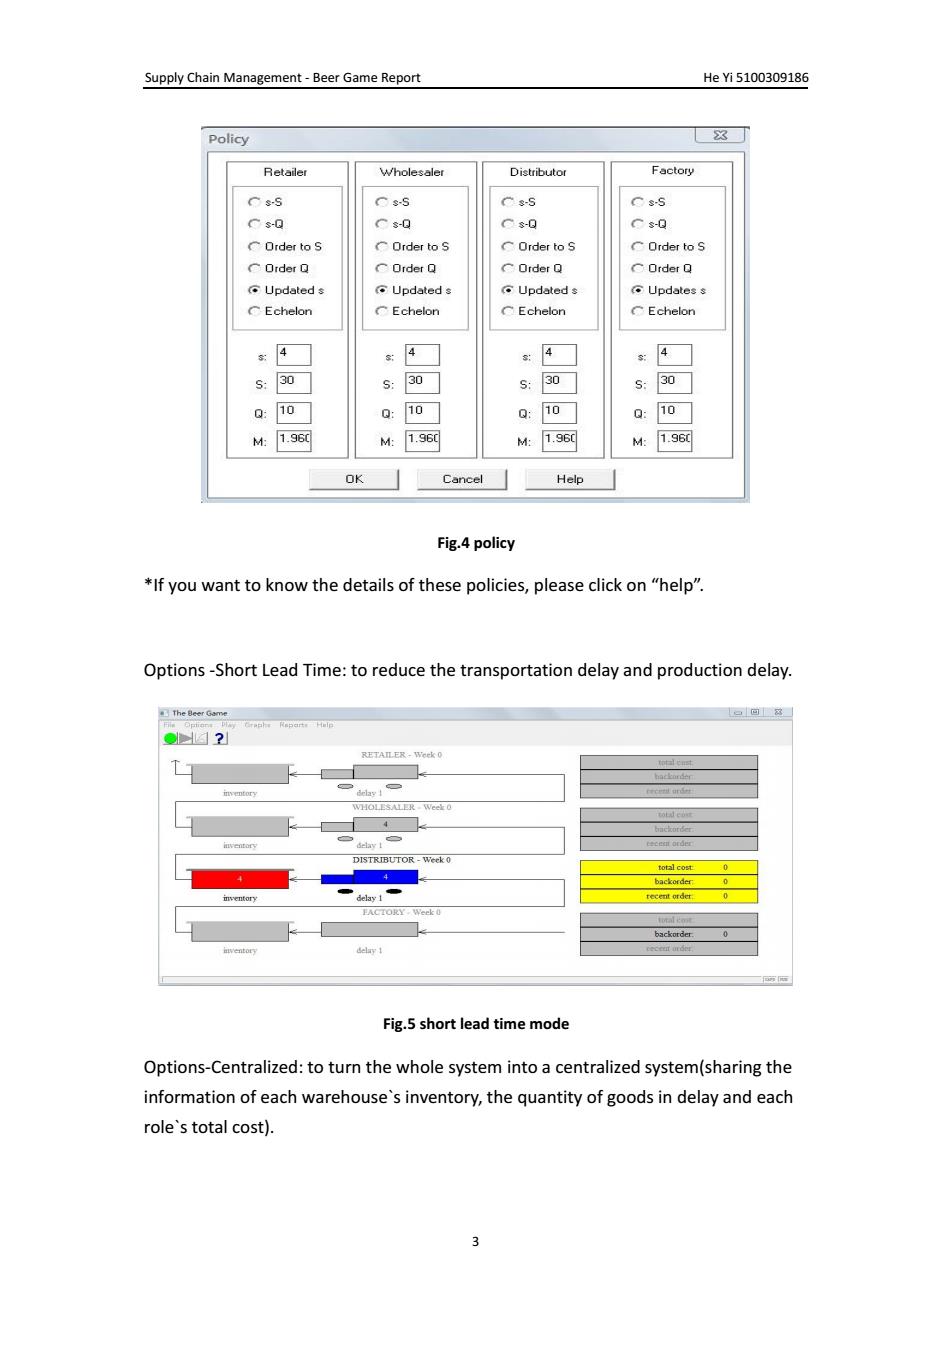
Supply Chain Management-Beer Game Report HeYi5100309186 Policy Retailer Wholesaler Distributor Factory Cs.S C$5 ●8-S Cs-S Cs-Q CsQ Cs-0 Cs-Q COrder toS COrder to S COrder to S COrder toS COrderQ Order Q COrder Q COrder Q Updated s Updated s Updated s Updates s CEchelon CEchelon CEchelon CEchelon s: 4 4 4 30 S: 30 S: 30 S: 30 Q: 10 Q: 10 Q: 10 Q: 10 M 1.960 M: 1.960 M: 1.960 1.96d OK Cancel Help Fig.4 policy *If you want to know the details of these policies,please click on"help". Options-Short Lead Time:to reduce the transportation delay and production delay. The Beer Game ●✉2 RETAILER-Week 0 hat业nter inventory WHOLESALER-Week 0 4 cecemn order DISTRIBUTOR-Week 0 total cot 0 backorder 0 inventory 0 Fig.5 short lead time mode Options-Centralized:to turn the whole system into a centralized system(sharing the information of each warehouse's inventory,the quantity of goods in delay and each role's total cost)
Supply Chain Management - Beer Game Report He Yi 5100309186 3 Fig.4 policy *If you want to know the details of these policies, please click on “help”. Options -Short Lead Time: to reduce the transportation delay and production delay. Fig.5 short lead time mode Options-Centralized: to turn the whole system into a centralized system(sharing the information of each warehouse`s inventory, the quantity of goods in delay and each role`s total cost)

Supply Chain Management-Beer Game Report HeYi5100309186 The Beer Game -回8 Fiie Optians Play Grapht Reparts Relp oD4 RETAILER-Week 0 bockorder iventory WHOLESALER-Week 0 tetalcom backorder delay 1 recent order DISTRIBUTOR-Wee生0 lotal cost 4 4 hackoeder recert order FACTORY-Week 0 total cost 0 4 4 backorder NA inventory delay 1 delay 2 recent order.0 Fig.6 centralized mode Options-Global Information:to make the information of each role visible. The Beer Game 回 File Opbons Play Graphs Report Help ☑2 RETAILER,eO 4 4 WHOLESALER -Week 0 total cot hacketder 即entory tecm过gd过 total coxt 4 k ventory tcct世o同a FACTORY-Week 0 total cost 0 4 4 backorder: 0 delay 2 recent order 0 Fig.7 global information mode Options-Demand:to set the type of demand
Supply Chain Management - Beer Game Report He Yi 5100309186 4 Fig.6 centralized mode Options - Global Information: to make the information of each role visible. Fig.7 global information mode Options-Demand: to set the type of demand
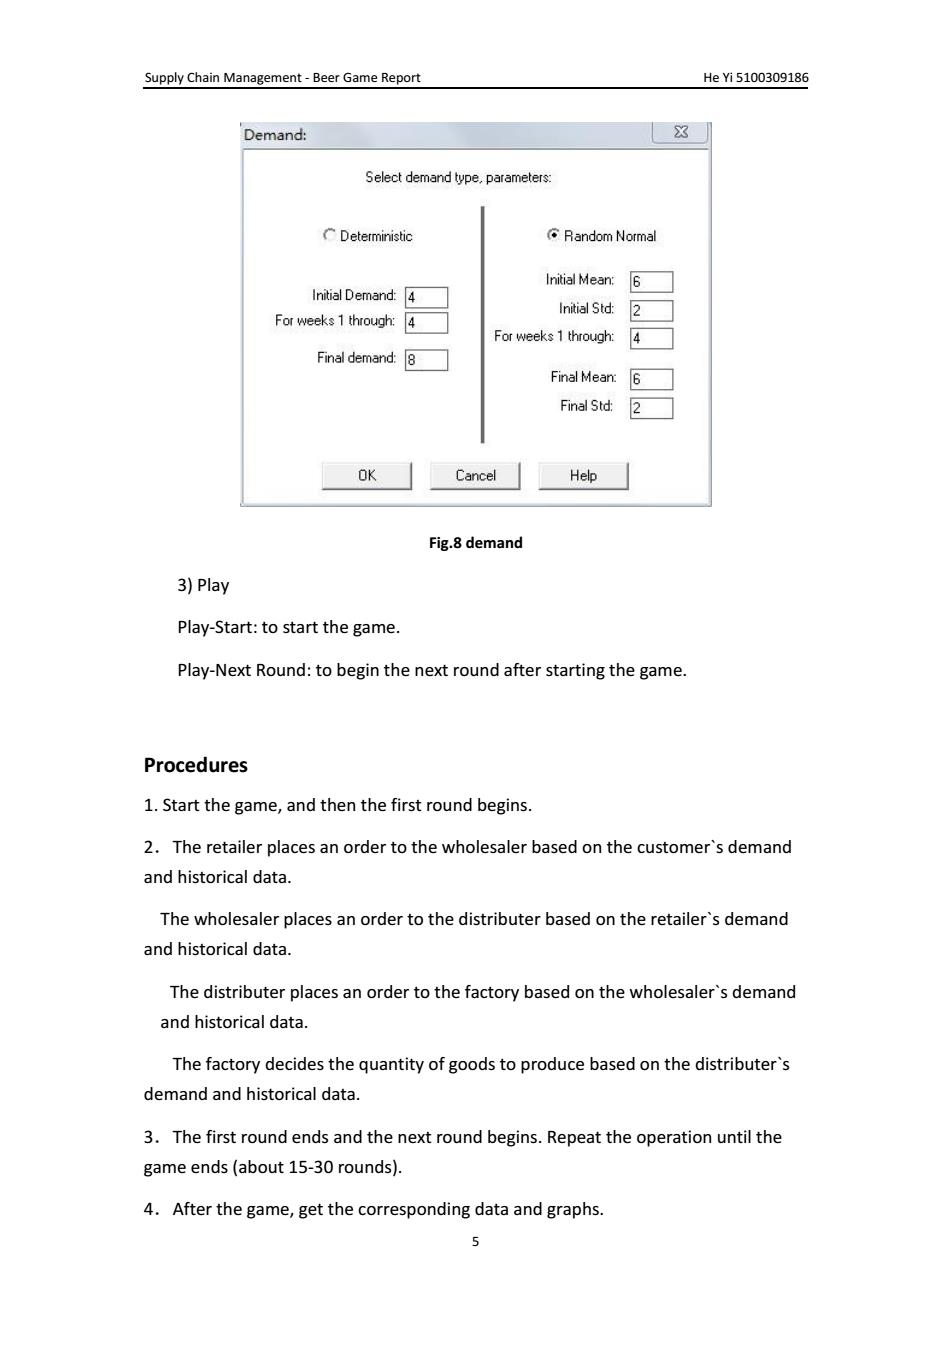
Supply Chain Management-Beer Game Report HeYi5100309186 Demand: 3 Select demand type,parameters: Deterministic Random Normal Initial Mean: 6 Initial Demand: Initial Std: For weeks 1 through: 2 For weeks 1 through: 4 Final demand: 8 Final Mean: 6 Final Std: 2 OK Cancel Help Fig.8 demand 3)Play Play-Start:to start the game. Play-Next Round:to begin the next round after starting the game. Procedures 1.Start the game,and then the first round begins. 2.The retailer places an order to the wholesaler based on the customer's demand and historical data. The wholesaler places an order to the distributer based on the retailer's demand and historical data The distributer places an order to the factory based on the wholesaler's demand and historical data. The factory decides the quantity of goods to produce based on the distributer's demand and historical data. 3.The first round ends and the next round begins.Repeat the operation until the game ends (about 15-30 rounds). 4.After the game,get the corresponding data and graphs. 5
Supply Chain Management - Beer Game Report He Yi 5100309186 5 Fig.8 demand 3) Play Play-Start: to start the game. Play-Next Round: to begin the next round after starting the game. Procedures 1. Start the game, and then the first round begins. 2.The retailer places an order to the wholesaler based on the customer`s demand and historical data. The wholesaler places an order to the distributer based on the retailer`s demand and historical data. The distributer places an order to the factory based on the wholesaler`s demand and historical data. The factory decides the quantity of goods to produce based on the distributer`s demand and historical data. 3.The first round ends and the next round begins. Repeat the operation until the game ends (about 15-30 rounds). 4.After the game, get the corresponding data and graphs
Supply Chain Management-Beer Game Report HeYi5100309186 5.Conduct the game again by short lead time and analyze the result. 6.Conduct the game for the third time by centralized system and analyze the result. 7.Analyze the costs and other information of the game under three different conditions. Result Analysis 1.Choose the distributor as the role,choose the rensent order based on the order datas.Play 20 rounds,the results shows like this 7The Beer Gam 回 U1◆tas且g实asB1s1p ●儿? RETAILER-Week 20 total cost:148 5 1 backorder:0 @ inventory delay 1 ielay 2 recent order: 3 WHOLESALER-Week 20 total cost:314 21 0 4 backorder:0 inventory recent order:0 DISTRIBUTOR-Week 20 total cost:479 38 1 0 backorder:0 ●● ● inventory delay 1 delay 2 recent order: 0 FACTORY-Week 20 total cost 914 零 0 0 backorder 0 inventory delay 1 delay 2 recent order: 0 Fig.9 default setting preface 6
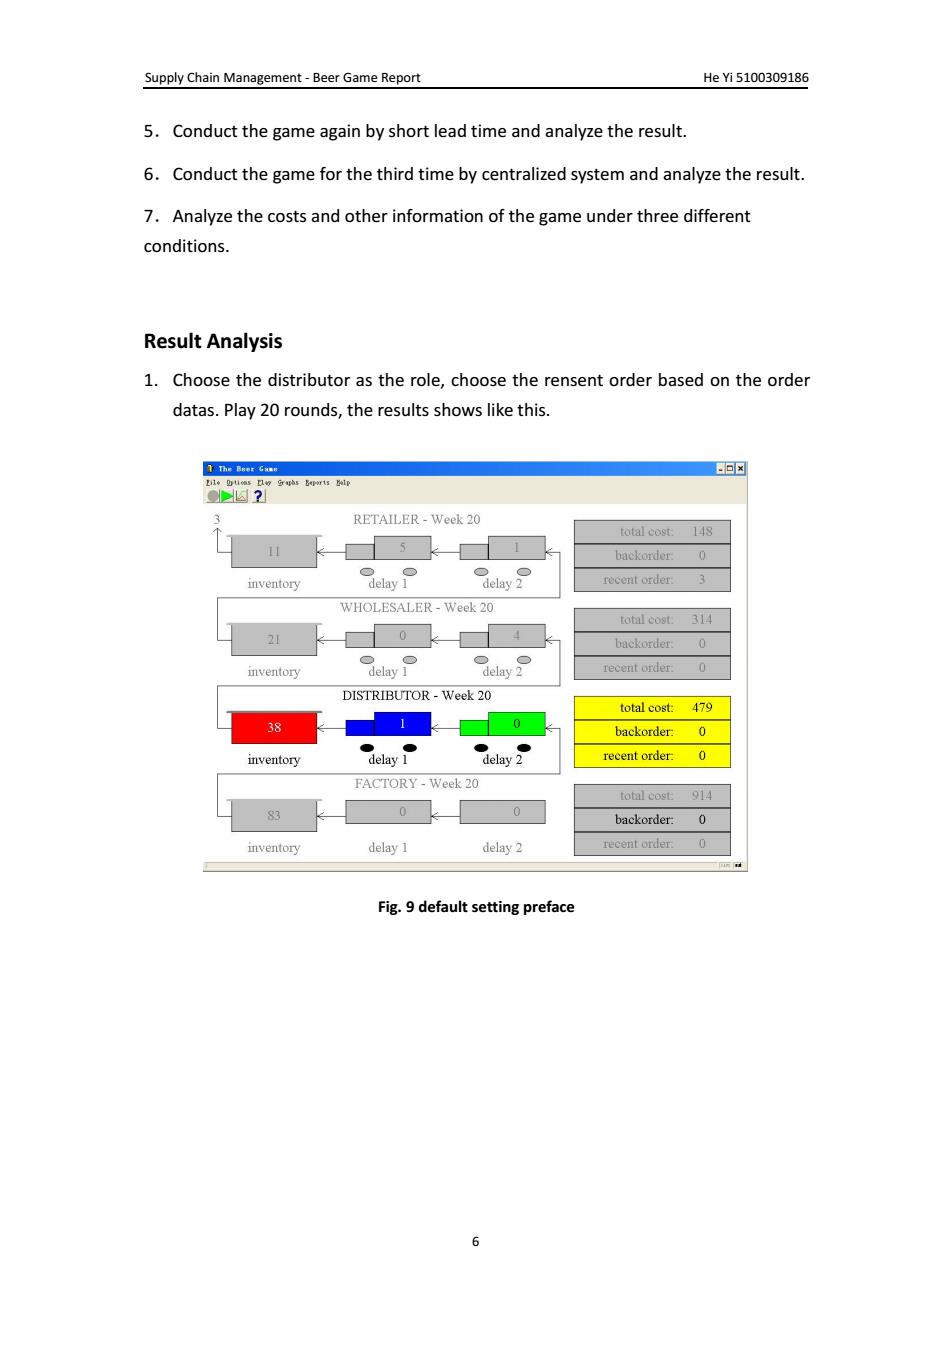
Supply Chain Management - Beer Game Report He Yi 5100309186 6 5.Conduct the game again by short lead time and analyze the result. 6.Conduct the game for the third time by centralized system and analyze the result. 7.Analyze the costs and other information of the game under three different conditions. Result Analysis 1. Choose the distributor as the role, choose the rensent order based on the order datas. Play 20 rounds, the results shows like this. Fig. 9 default setting preface
Supply Chain Management-Beer Game Report HeYi5100309186 ■Graph ☒ OK Orders 26 26 Retailer Whole- T 18 +18 saler Distrib utor 11 +11 Factory 0 8 Time Fig.10 default setting graph Report: Summary Report -Retailer -Wholesaler- Mean:5.35 Mean:5.85 SD:3.47 SD:7.62 Cost:148 Cost 314 Distributor- -Factory- Mean:7.20 Mean:10.75 SD:10.83 SD:13.80 Cost:479 Cost:914 System Cost 1855 OK E Help] Fig.11 Default setting report Result analysis: From the result above we can see the bullwhip effect clearly,which is the increase in variability as we travel up in the supply chain.While customer demand for specific products does not very much,inventory and back-order levels fluctuate considerably across their supply chain. From the graph,when the demand from the retailer varies not very much,the demand of the wholesaler varies clearly more,the demand of the distributor 7
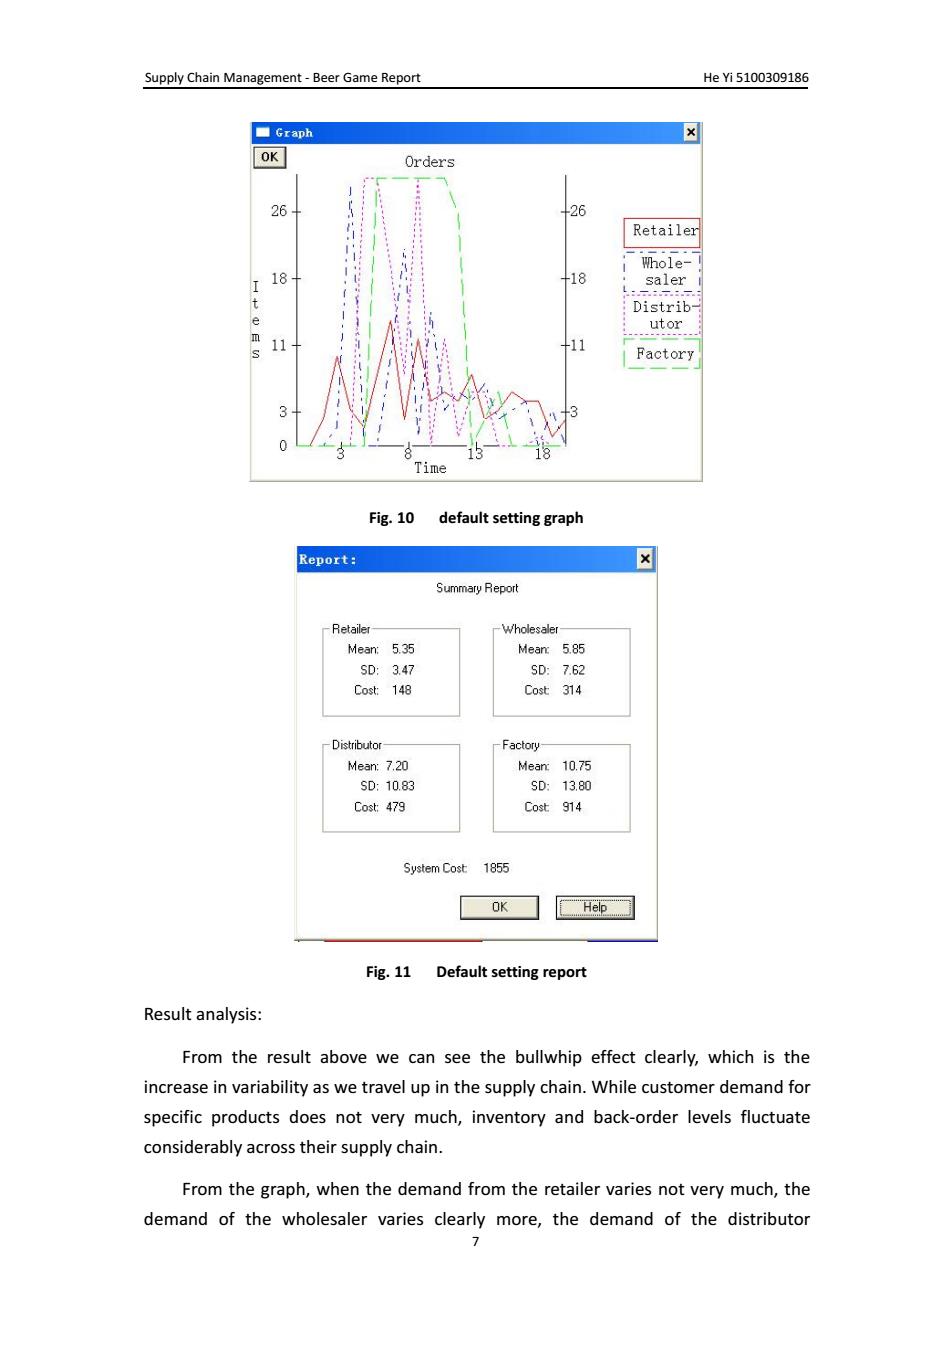
Supply Chain Management - Beer Game Report He Yi 5100309186 7 Fig. 10 default setting graph Fig. 11 Default setting report Result analysis: From the result above we can see the bullwhip effect clearly, which is the increase in variability as we travel up in the supply chain. While customer demand for specific products does not very much, inventory and back-order levels fluctuate considerably across their supply chain. From the graph, when the demand from the retailer varies not very much, the demand of the wholesaler varies clearly more, the demand of the distributor
Supply Chain Management-Beer Game Report HeYi5100309186 changes more than wholesaler's,while the demand of the factory varies the most and shows the great fluctuation. From the report,we can see that the mean of the retailer demand is the least, wholesaler has a larger mean,distributor's mean even larger,and the mean of the factory is the largest.The standard deviation(SD)has the same rank,so as the cost. Which means across the supply chain,the mean of the order would become more because of the larger order fluctuation (Which can be seen from the larger SD),and this can cause a larger total cost. 2.Choose Short lead time mode then run the game for 20 rounds,the result shows as follows: The Boer Caue 回冈 E1t四tu6ai卫y女gbi好储u道 儿2 3 RETAILER-Week 20 total cost:52 3 backorder 0 inventory delay 1 recent order: 2 WHOLESALER-Week 20 total cost:140 10 2 backorder:0 inventory Selay recent order:2 DISTRIBUTOR-Week 20 total cost:341 11 6 backorder: 0 ● inventory delay 1 recent order:1 FACTORY-Week 20 total cost:627 54 0 backorder:0 inventory delay 1 recent order:0 Fig.12 short lead time preface
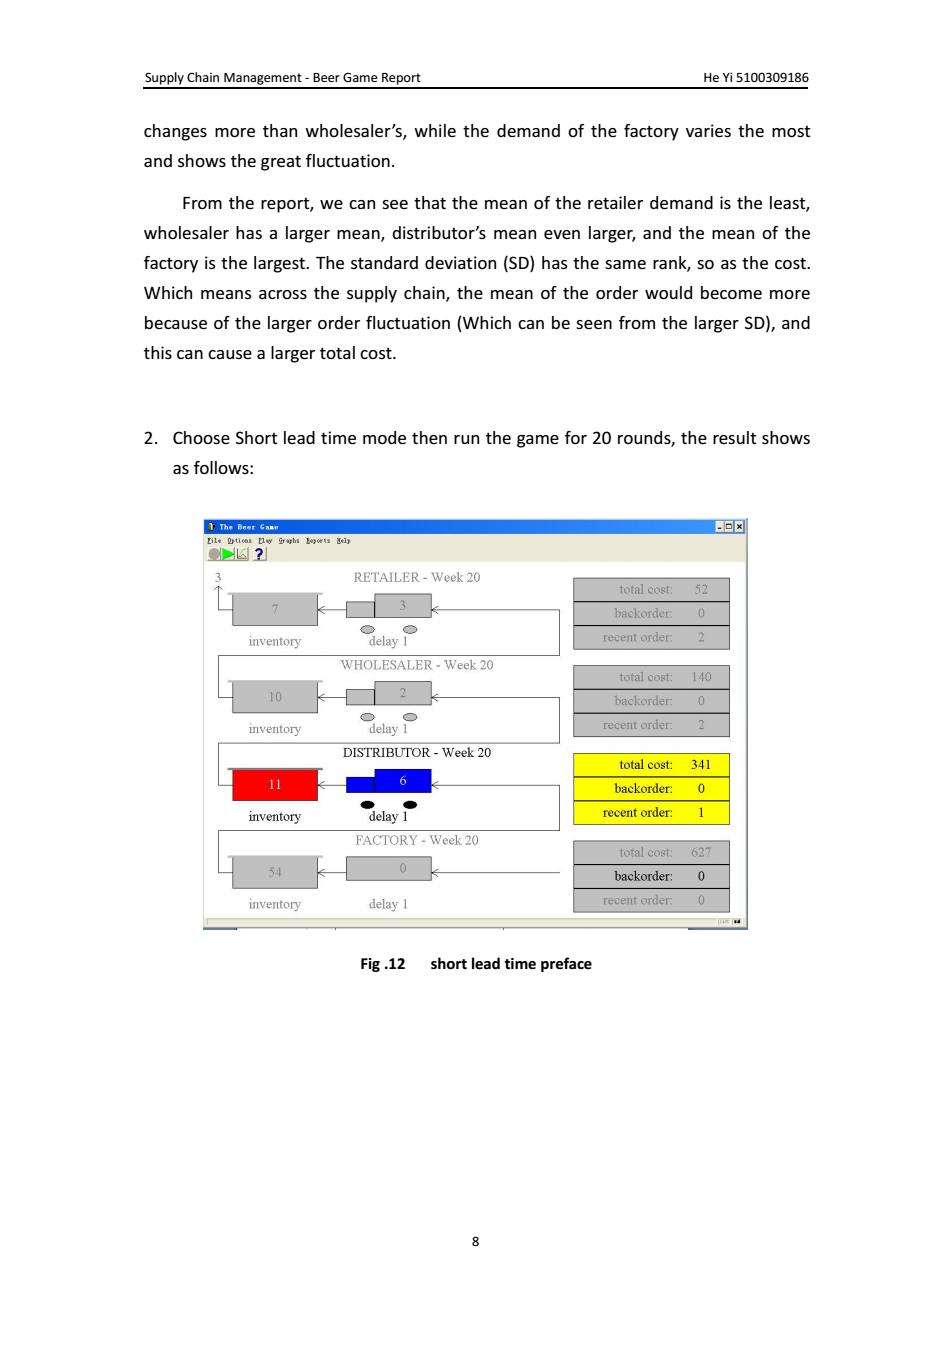
Supply Chain Management - Beer Game Report He Yi 5100309186 8 changes more than wholesaler’s, while the demand of the factory varies the most and shows the great fluctuation. From the report, we can see that the mean of the retailer demand is the least, wholesaler has a larger mean, distributor’s mean even larger, and the mean of the factory is the largest. The standard deviation (SD) has the same rank, so as the cost. Which means across the supply chain, the mean of the order would become more because of the larger order fluctuation (Which can be seen from the larger SD), and this can cause a larger total cost. 2. Choose Short lead time mode then run the game for 20 rounds, the result shows as follows: Fig .12 short lead time preface

Supply Chain Management-Beer Game Report HeYi5100309186 ■Graph OK Orders 26 26 Retailer Whole- 18 -18 saler ! Distrib- e utor 11 11 Factory Time Fig.13 short lead time graph Report: Summary Report -Retailer -Wholesaler- Mean:4.85 Mean:5.05 SD:287 SD:6.72 Cost:52 Cost 140 Distributor- -Factory Mean:5.45 Mean:7.70 SD:10.46 sD:12.90 Cost:341 Cost:627 System Cost:1160 OK Heb Fig.14 short lead time report Result analysis: After choosing the short lead time mode,we can see the result above.We can also see the bullwhip effect in the result. However,compare with the result in normal pattern,we can find that in the report,the variation of the mean is smaller,which is,as standard deviation grows 9
Supply Chain Management - Beer Game Report He Yi 5100309186 9 Fig. 13 short lead time graph Fig. 14 short lead time report Result analysis: After choosing the short lead time mode, we can see the result above. We can also see the bullwhip effect in the result. However, compare with the result in normal pattern, we can find that in the report, the variation of the mean is smaller, which is, as standard deviation grows
Supply Chain Management-Beer Game Report HeYi5100309186 across the supply chain,it grows less with the short lead time. This shows that lead time reduction can significantly reduce the bullwhip effect throughout a supply chain. 3.Choose Centralized pattern in operations.In this case,we can only be the factory. Play the game for 21 rounds,the results show as below. 0Thn际rGm -回x 国2 RETAILER-Week 21 total cost backorder. ○● inventory delay 1 delay 2 recent order. WHOLESALER-Week 21 total cost backorder. inventory recent order DISTRIBUTOR-Week 21 total cost 8 长 11 backorder ● inventory delay 1 delay2 recent order FACTORY-Week 21 total cost:306 0 11 8 backorder:N/A inventory delay I delay 2 recent order: 2 Fig.15 centralized preface ■Graph OK Factory 267 Inven- tory 191 Back- I D order 0 Order +114 a Cost 38 Time Fig.16 centralized graph 10
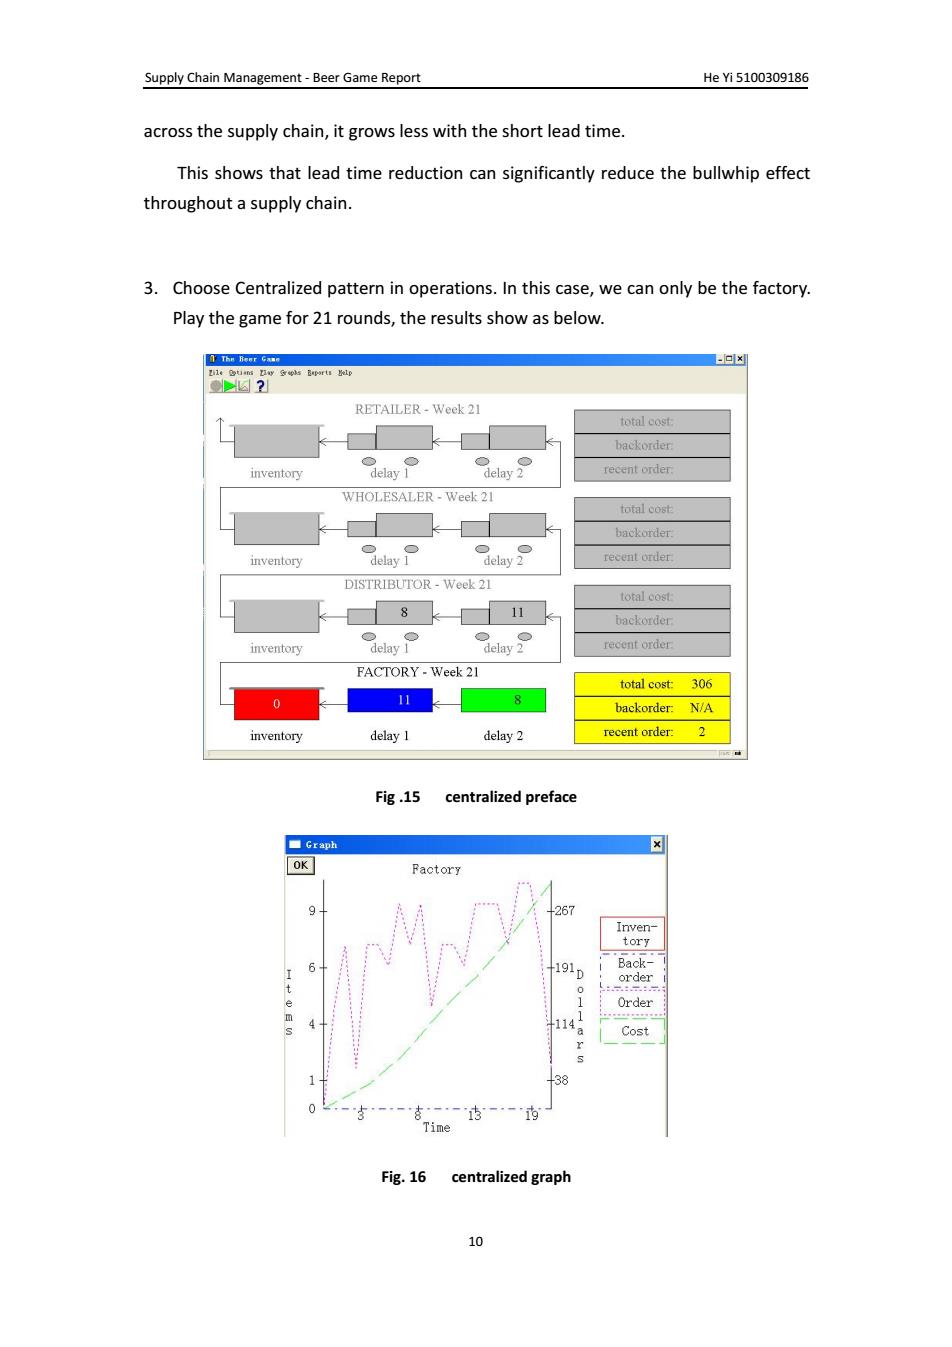
Supply Chain Management - Beer Game Report He Yi 5100309186 10 across the supply chain, it grows less with the short lead time. This shows that lead time reduction can significantly reduce the bullwhip effect throughout a supply chain. 3. Choose Centralized pattern in operations. In this case, we can only be the factory. Play the game for 21 rounds, the results show as below. Fig .15 centralized preface Fig. 16 centralized graph