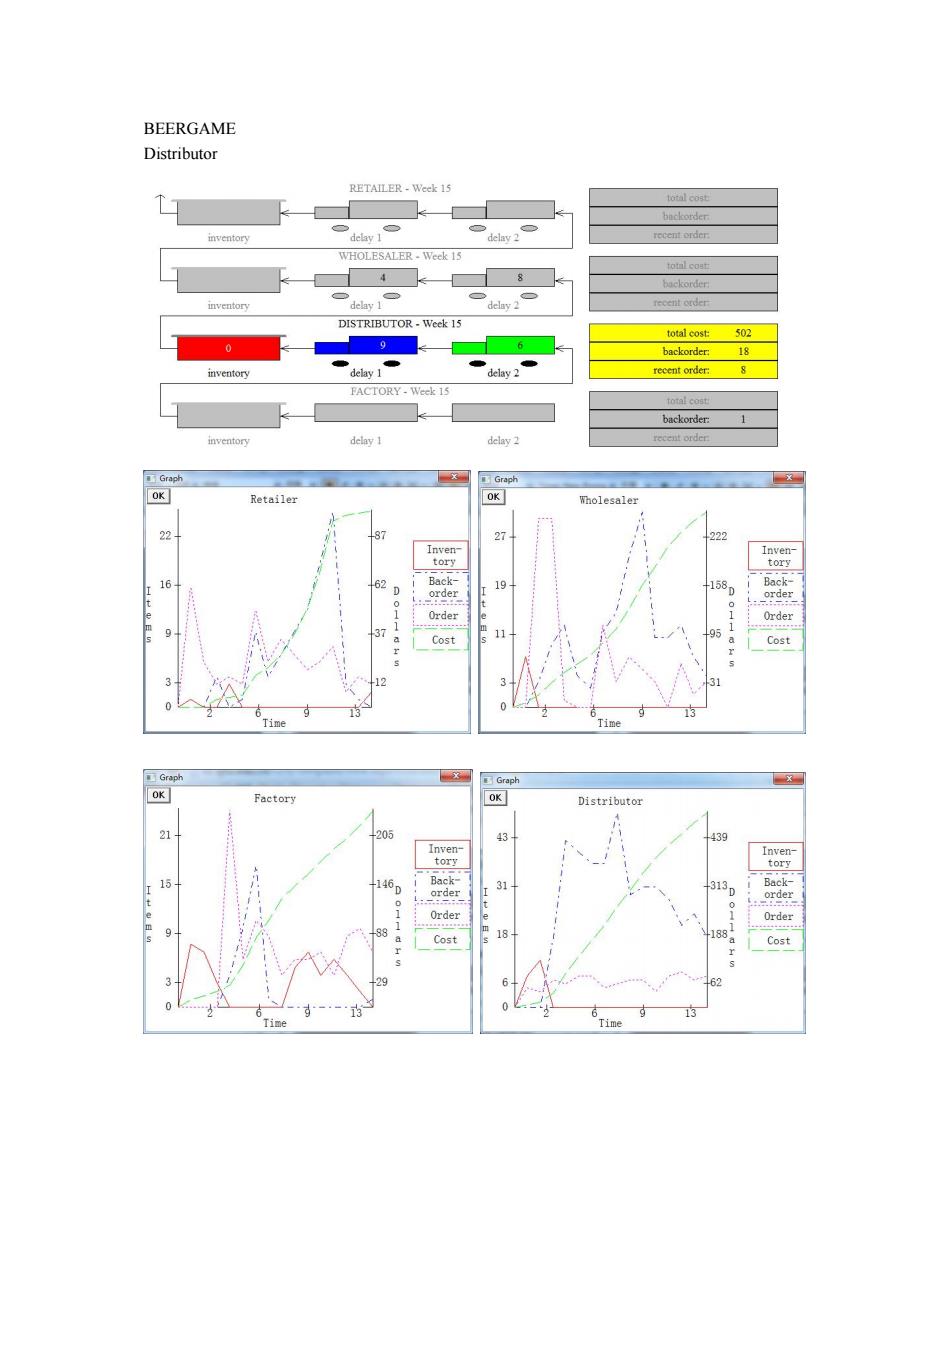
BEERGAME Distributor RETAILER-Week 15 total cost backorder inventory delay 2 recent order toml cost 4 backorder inventory delay 1 recent order DISTRIBUTOR-Week 15 total cost:502 9 6 backorder: 18 inventory delay 1 delay 2 recent order: 8 FACTORY-Week 15 total cost backorder: 1 inventory delay 1 delay 2 Graph Graph OK Retailer OK Wholesaler 22 87 222 Inven Inven- tory tory 16 62 Back- 0 orde 19 180 Back- order 1 Order 37 011ar Cost 11 Cost 12 3 A 15 me Graph Graph OK Factory OK Distributor 21 205 439 Inven- Inven tory .146 Back- 130 Back- order , order ? 。11 Order Order 88 Cost Cost +29 b. 62 0 6 13 Time ime
BEERGAME Distributor
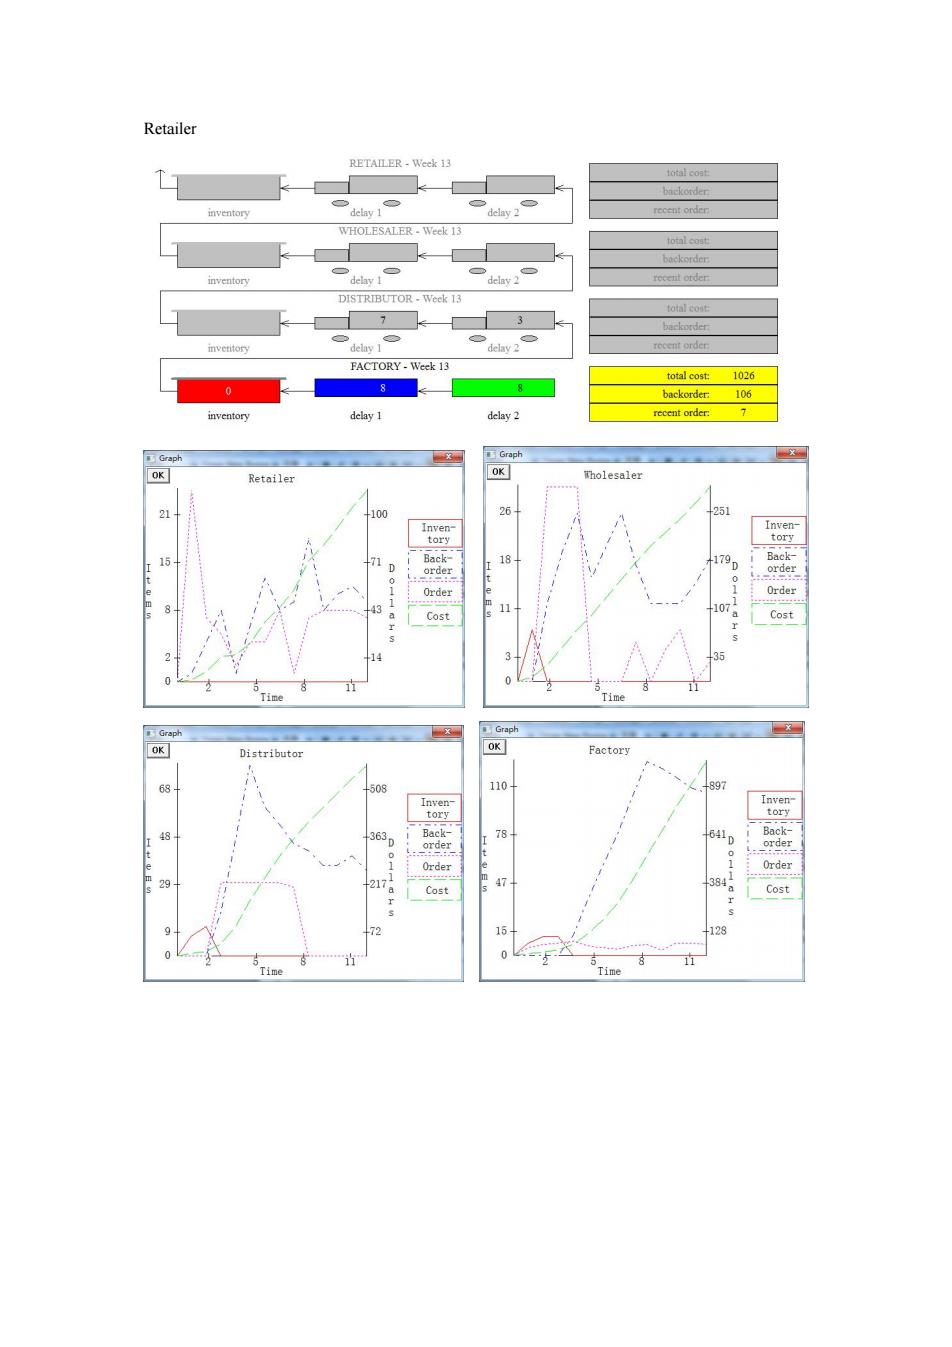
Retailer RETAILER-Week 13 batkotder inventory recent order WHOLESALER-Week 13 total cost backorder inventory delay 1 delay 2 recent order DISTRIBUTOR-Week 13 7 3 backorder inventory delay 2 rocent order FACTORY-Week 13 total cost:1026 0 8 8 backorder:106 inventory delay 1 delay 2 recent order: 7 Graph Graph OK Retailer OK 100 26 251 Inven- Inven tory tory 15 11 Back- 0 18 1 order 0 43 011a der Order 107 Cost Cost 14 3 0 Time Time Graph Graph OK Distributor OK Factory 68 508 110 +897 Inven Inven tory tory 363 Back 78 641 Back- order D order a11 der O Order ”” 47 384 Cost Cost 72 16 -128 0 Time Time
Retailer
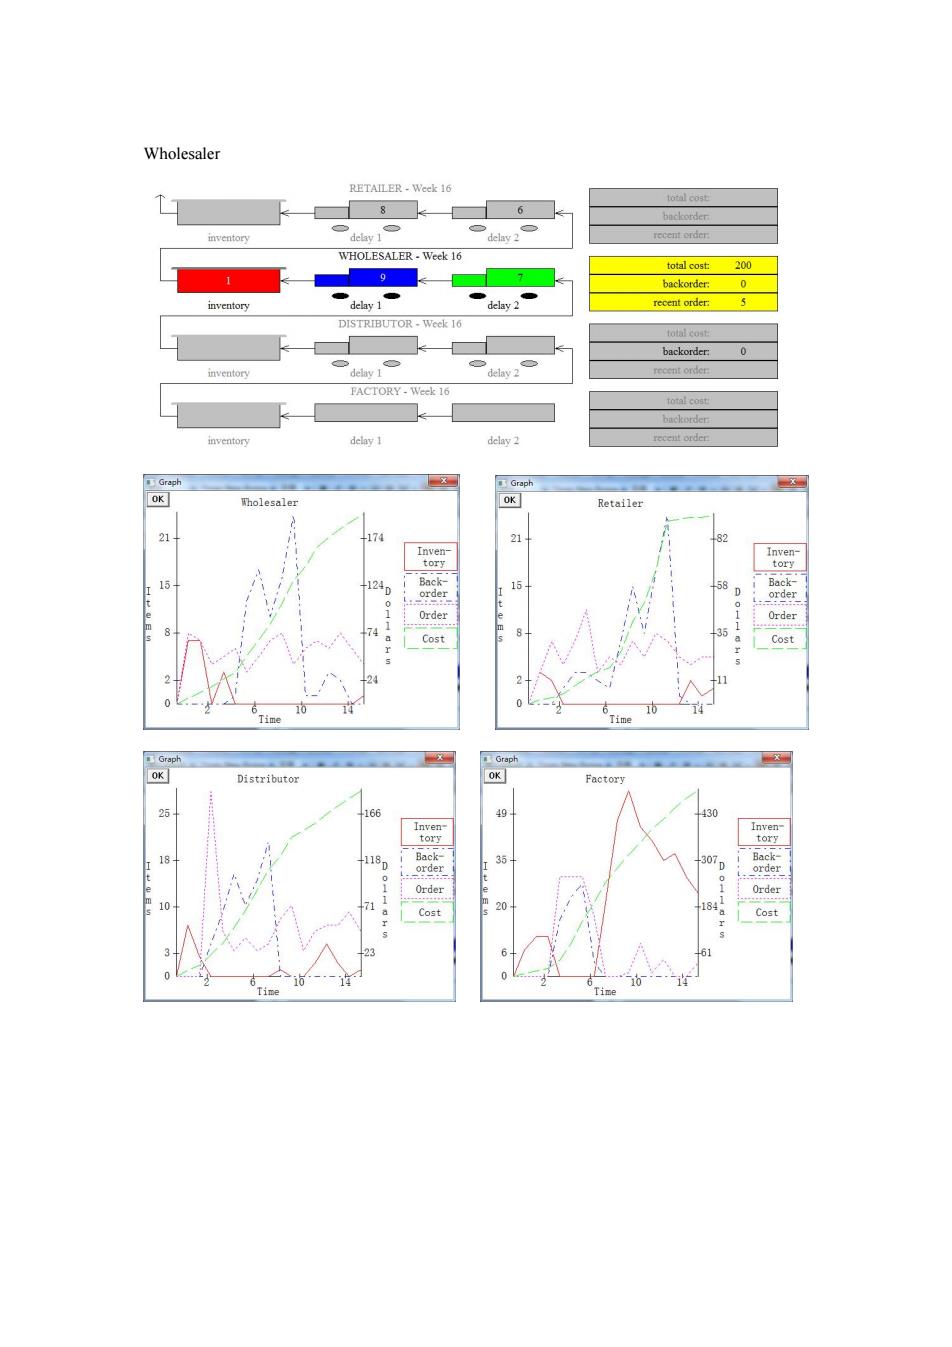
Wholesaler RETAILER-Week 16 total cost 8 6 inventory reccnt order WHOLESALER-Week 16 total cost:200 1 9 backorder: 0 inventory delay 2 recent order: DISTRIBUTOR-Week 16 0 inventory delay 2 recent order FACTORY-Week 16 total cost backorder inventory delay 1 delay 2 recent order Graph Graph OK Wholesaler OK Retailer -174 21 82 Inven- Inven- tory tory 15 240 Back- order Order Cost 8 35 Dol1a Cost 0 6 0 Time Time Graph Graph OK Distributor OK Factory 的 166 49 430 Inven- Inven tory tory 18 118 Bac 35 30 D Back- order Order Q1 Order 20 Cost 1840 Cost 2 61 0 0 10 ime
Wholesaler
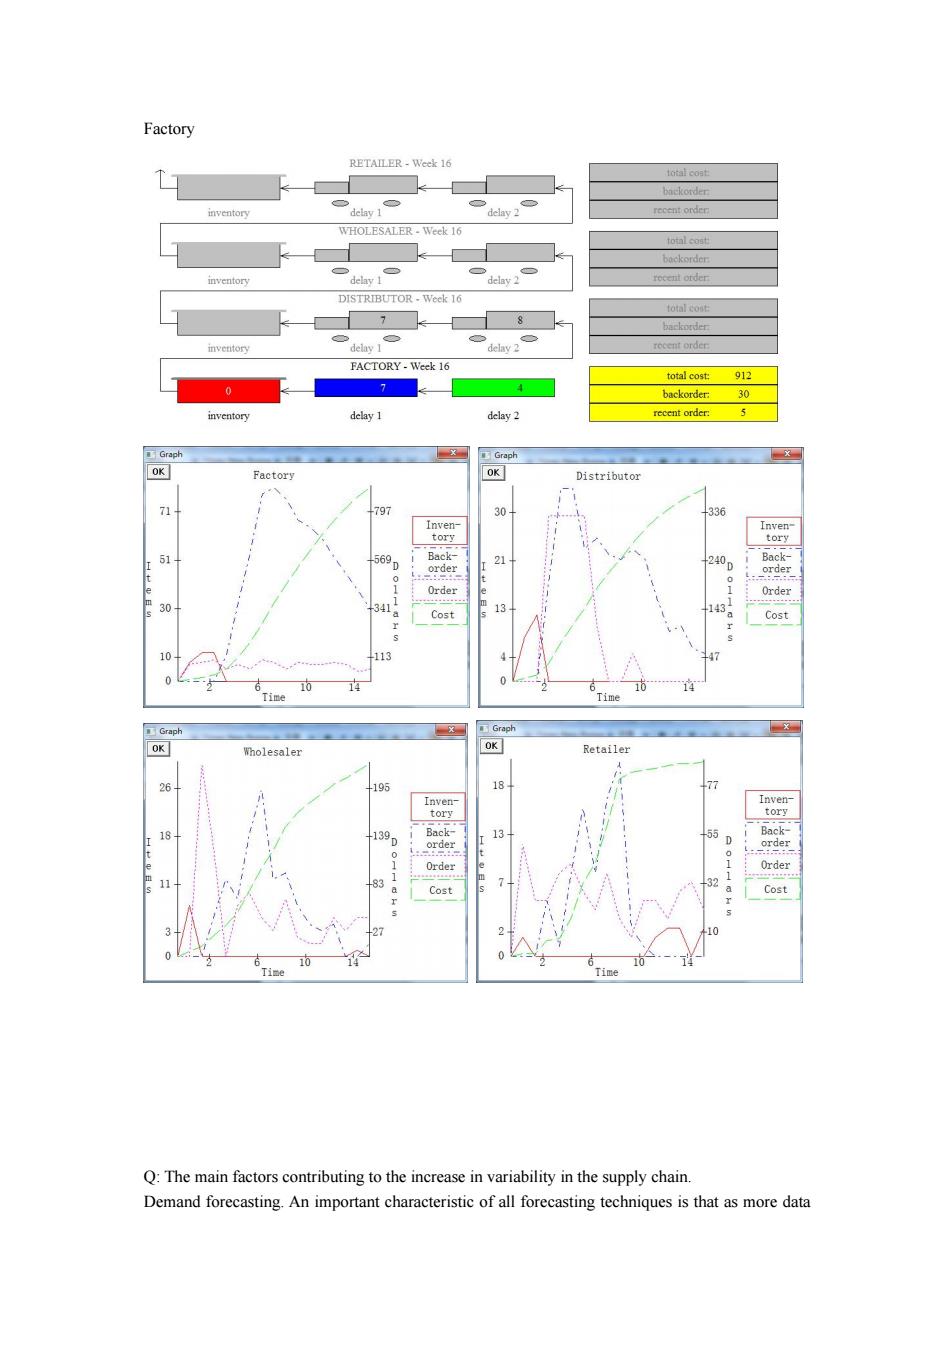
Factory RETAILER-Week 16 batkotder inventory recent order WHOLESALER-Week 16 total cost backorder inventory delay 2 recent order DISTRIBUTOR-Week 16 total cose 7 8 backorder: inventory recent order FACTORY-Week 16 total cost:912 0 7 backorder:30 inventory delay 1 delay 2 recent order: 5 Graph Graph OK Factory OK Distributor 个 797 30 336 Inven Inven- tory tory 51 569 Back- 200 Back- order 0 order Order Order 30 341 13 143 Cost Cost 10 113 10 1 10 Time Time Graph Graoh OK Wholesaler OK Retailer 26 195 77 Inven- Inven- torv 18 139 Back- 13 55 Back- order order Order 1 1 11 32 Cost a Cost 10 Time Time Q:The main factors contributing to the increase in variability in the supply chain. Demand forecasting.An important characteristic of all forecasting techniques is that as more data
Factory Q: The main factors contributing to the increase in variability in the supply chain. Demand forecasting. An important characteristic of all forecasting techniques is that as more data
are observed,the estimates of the mean and the standard deviation of customer demands are regularly modified.Since safety stock,as well as the base-stock level,strongly depends on these estimates,the user is forced to change order quantities,thus increasing variability. Lead time.To calculate safety stock levels and base-stock levels,we in effect multiply estimates of the average and standard deviation of the daily customer demands by the sum of the lead time and the review period.Thus,with longer lead times,a small change in the estimate of demand variability implies a significant change in safety stock and base-stock level,leading to a significant change in order quantities.This,of course,leads to an increase in variability. Batch ordering.If the retailer uses batch ordering,as happens when using a(Q,R)inventory policy or a min-max policy,then the wholesaler will observer a large order,followed by several periods of no orders,followed by another large order,and so on.Thus,the wholesaler sees a distorted and highly variable pattern of orders. Price fluctuation.If prices fluctuate,retailers often attempt to stock up when prices are lower.This is accentuated by the prevailing practice in many industries of offering promotions and discounts at certain times or for certain quantities.This practice,referred to as forward buying,implies that retailers purchase large quantities during distributors'and manufacturers'discount and promotion time and order relatively small quantities at other time periods. Inflated orders.Inflated orders placed by retailers during shortage periods tend to magnify the bullwhip effect.Such orders are common when retailers and distributors suspect that a product will be in short supply,and therefore anticipate receiving supply proportional to the amount orders When the period of shortage is over,the retailer goes back to its standard orders,leading to all kinds of distortions and variations in demand estimates. Comparison Result: Information sharing could reduce costs,but can not offset the loss caused by bullwhip effect. Beer game sufficiently expresses the bullwhip effect,and it can't be offset. Advice: Information sharing is the key enabler of integrating the different supply chain stages and discussed how information can be reduce the necessity of many these trade-offs
are observed, the estimates of the mean and the standard deviation of customer demands are regularly modified. Since safety stock, as well as the base-stock level, strongly depends on these estimates, the user is forced to change order quantities, thus increasing variability. Lead time. To calculate safety stock levels and base-stock levels, we in effect multiply estimates of the average and standard deviation of the daily customer demands by the sum of the lead time and the review period. Thus, with longer lead times, a small change in the estimate of demand variability implies a significant change in safety stock and base-stock level, leading to a significant change in order quantities. This, of course, leads to an increase in variability. Batch ordering. If the retailer uses batch ordering, as happens when using a (Q, R) inventory policy or a min-max policy, then the wholesaler will observer a large order, followed by several periods of no orders, followed by another large order, and so on. Thus, the wholesaler sees a distorted and highly variable pattern of orders. Price fluctuation. If prices fluctuate, retailers often attempt to stock up when prices are lower. This is accentuated by the prevailing practice in many industries of offering promotions and discounts at certain times or for certain quantities. This practice, referred to as forward buying, implies that retailers purchase large quantities during distributors’ and manufacturers’ discount and promotion time and order relatively small quantities at other time periods. Inflated orders. Inflated orders placed by retailers during shortage periods tend to magnify the bullwhip effect. Such orders are common when retailers and distributors suspect that a product will be in short supply, and therefore anticipate receiving supply proportional to the amount orders. When the period of shortage is over, the retailer goes back to its standard orders, leading to all kinds of distortions and variations in demand estimates. Comparison Result: Information sharing could reduce costs, but can not offset the loss caused by bullwhip effect. Beer game sufficiently expresses the bullwhip effect, and it can’t be offset. Advice: Information sharing is the key enabler of integrating the different supply chain stages and discussed how information can be reduce the necessity of many these trade-offs