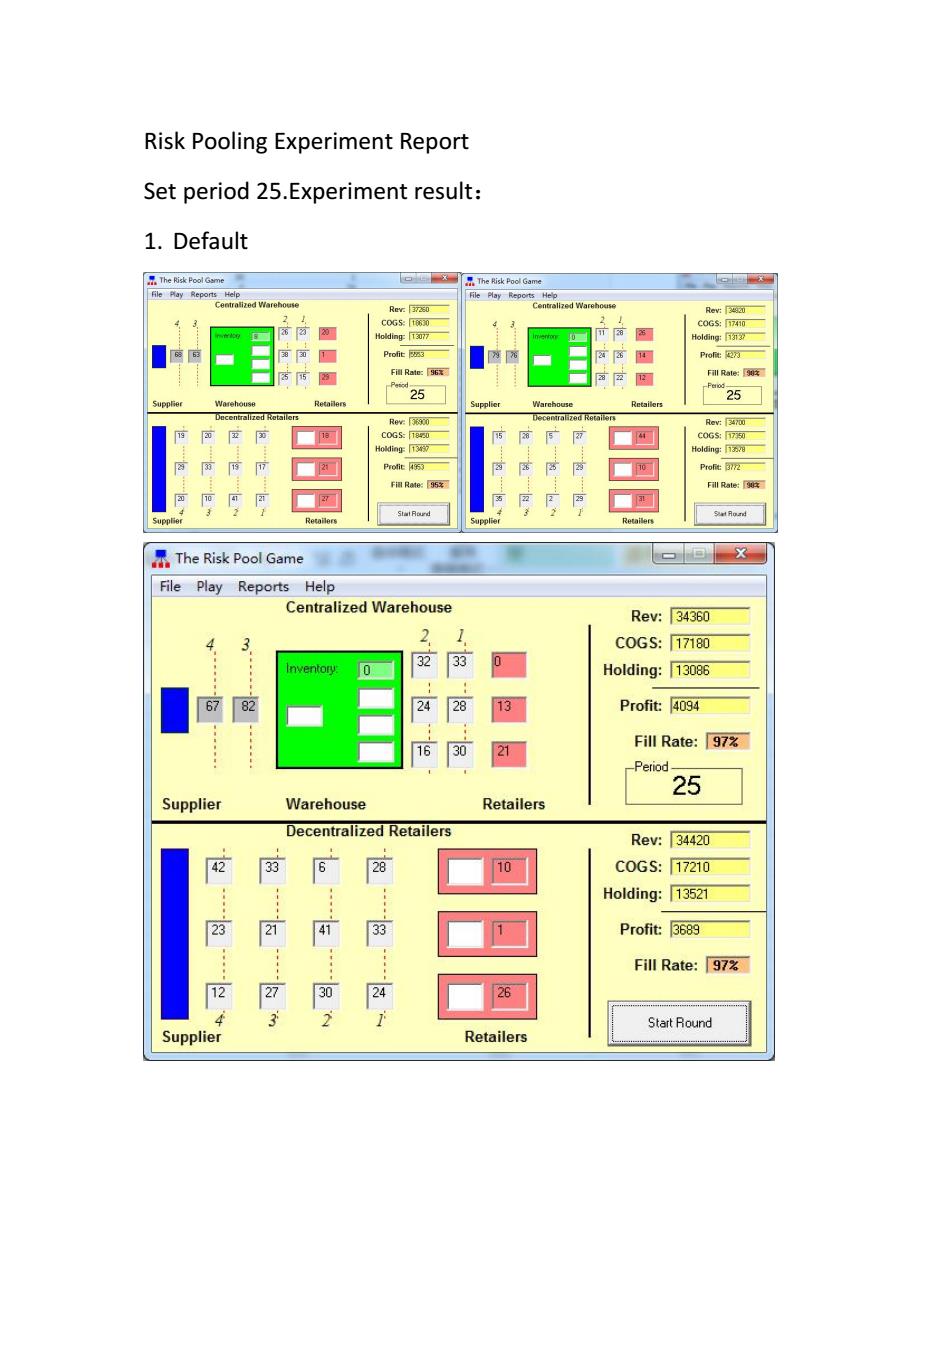
Risk Pooling Experiment Report Set period 25.Experiment result: 1.Default The Risk Pool Game The Risk Pool Game File Pay Repo File Play Reports Rev:[37250 Rer:4动 C0G5t630 C0G:7410 20 Holding:T3077 Holding:33 Profit3 Pot2 55 Fill Rate: Fill Rate:9收 25 25 Warehouse Warchouse Retailers Decentralized Retallers Re3300 R@r:面 C0GS80 C0G570 Holding:1338 3117 FiRa895之 Fill Rate:收 Re0e卷 The Risk Pool Game X File Play Reports Help Centralized Warehouse Rev:34360 4 2 C0GS:17180 Inventory: 0 32 33 0 Holding:13086 6782 24 28 13 Profit:4094 16 30 21 Fill Rate:97 Period 25 Supplier Warehouse Retailers Decentralized Retailers Rev:34420 33 6 28 10 C0GS:17210 Holding:13521 23 … 33 Profit:3689 Fill Rate:97% 24 2 32 Start Round Supplier Retailers
Risk Pooling Experiment Report Set period 25.Experiment result: 1. Default

2.Demand Correlation Strong Positive 黑The Risk Pool Game The Risk Pool Game Fie Play Reports Centralized Wareho Rev: C0GS:140 COGS:1680 Holding:12375 Holding:131535 2 Fill Rate:94 20 Fill Rate: 25 25 Supplier Warehouse Retailers Supplier Warehouse Retailers Decentralize Rev:330 ers Rev:33840 20 C0G5:1930 C0G5:16s00 Holding:13417.5 Holding:13587 Protit:3333 Fill Rate:972 Fill Rate: 2 Retailer Supplier Retailers 界The Risk Pool Game X File Play Reports Help Centralized Warehouse Re:29440 4 3 2 1 C0GS:14720 Inventory 50 25 27 Holding:13152 76 3 23 28 Profit:1568 28 30 Fill Rate:98% Period 25 Supplier Warehouse Retailers Decentralized Retailers Rev:29520 25 5 32 28 29 Cc0GS:14760 Holding: 13588.5 33 26 Profit:1171.5 Fill Rate:99% 28 季 37 38 Start Round Supplier Retailers
2. Demand Correlation Strong Positive
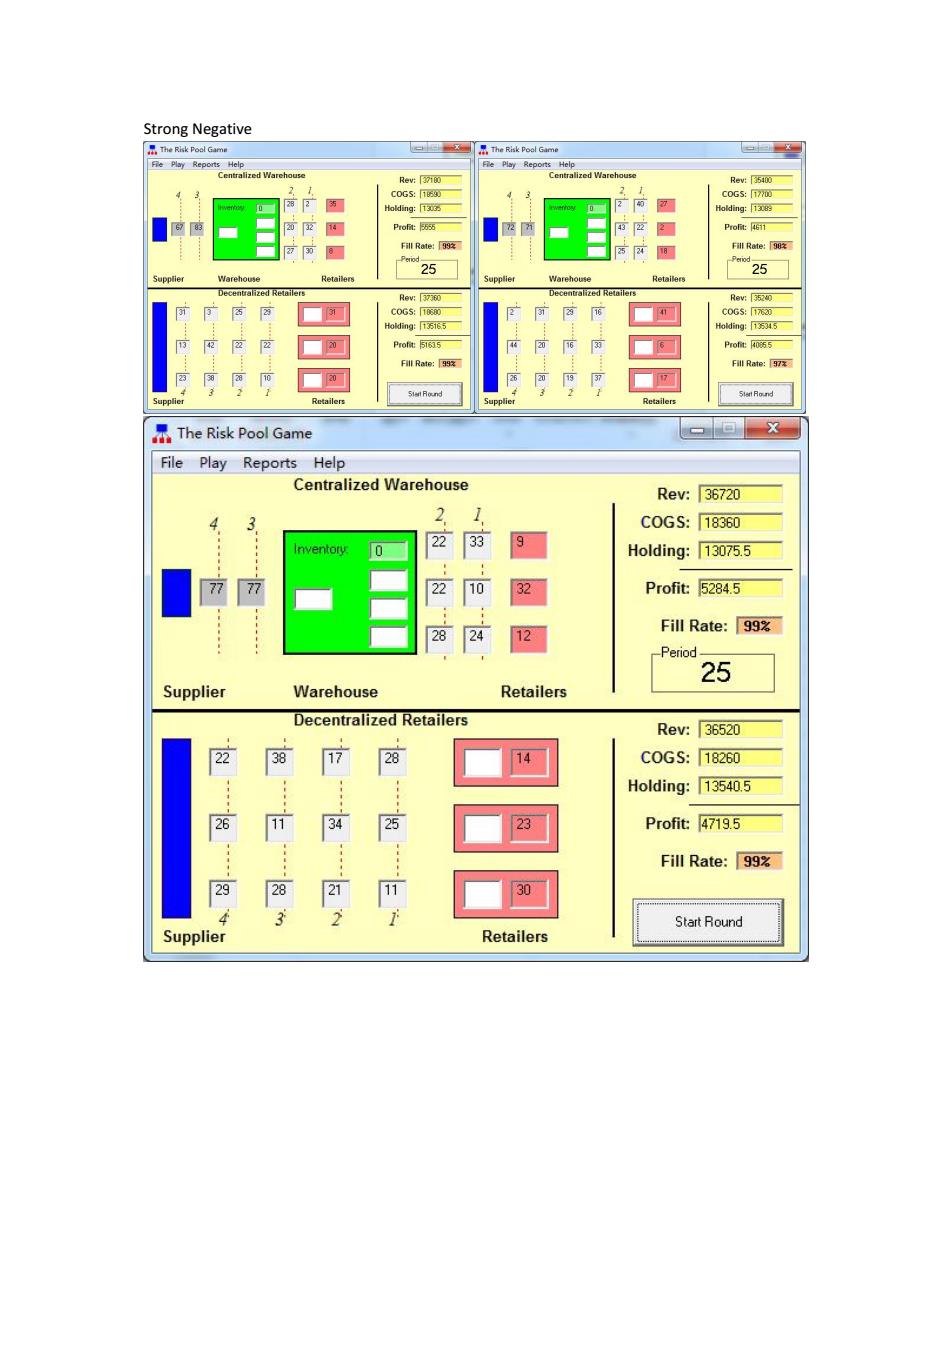
Strong Negative The Risk Pool Game e The Risk Pool Game Fie Play Reports Help File Play Reports Help Centralized Warehouse Rev姓7i0 Centralized Warehouse Rew:35400 COGS:[ COGS:[1 Holding:1303 Holding:13083 Profit:555 Prolit:4611 Fill Rate:9 Fill Rate:90 Retailers 25 25 Supplier Warehouse Supplier Warehouse Decentralized Retailers Re:3730 Decentralized Retailers Rev:3520 C0G5:10 C0G5:17630 Holding:135165 Holding:13534.5 Profit:51635 Proft:R055 Fll Rate: Fill Rate:7 Retailers Start Round The Risk Pool Game X File Play Reports Help Centralized Warehouse Rev:36720 4 3 2. C0GS:18360 0 22 33 9 Holding:13075.5 77 22 10 32 Profit:5284.5 28 24 12 Fill Rate:99% Period 25 Supplier Warehouse Retailers Decentralized Retailers ReV:36520 3阳 28 14 C0GS:18260 2: m Holding:13540.5 25 23 Profit:4719.5 Fill Rate:99% 30 Start Round Supplier Retailers
Strong Negative
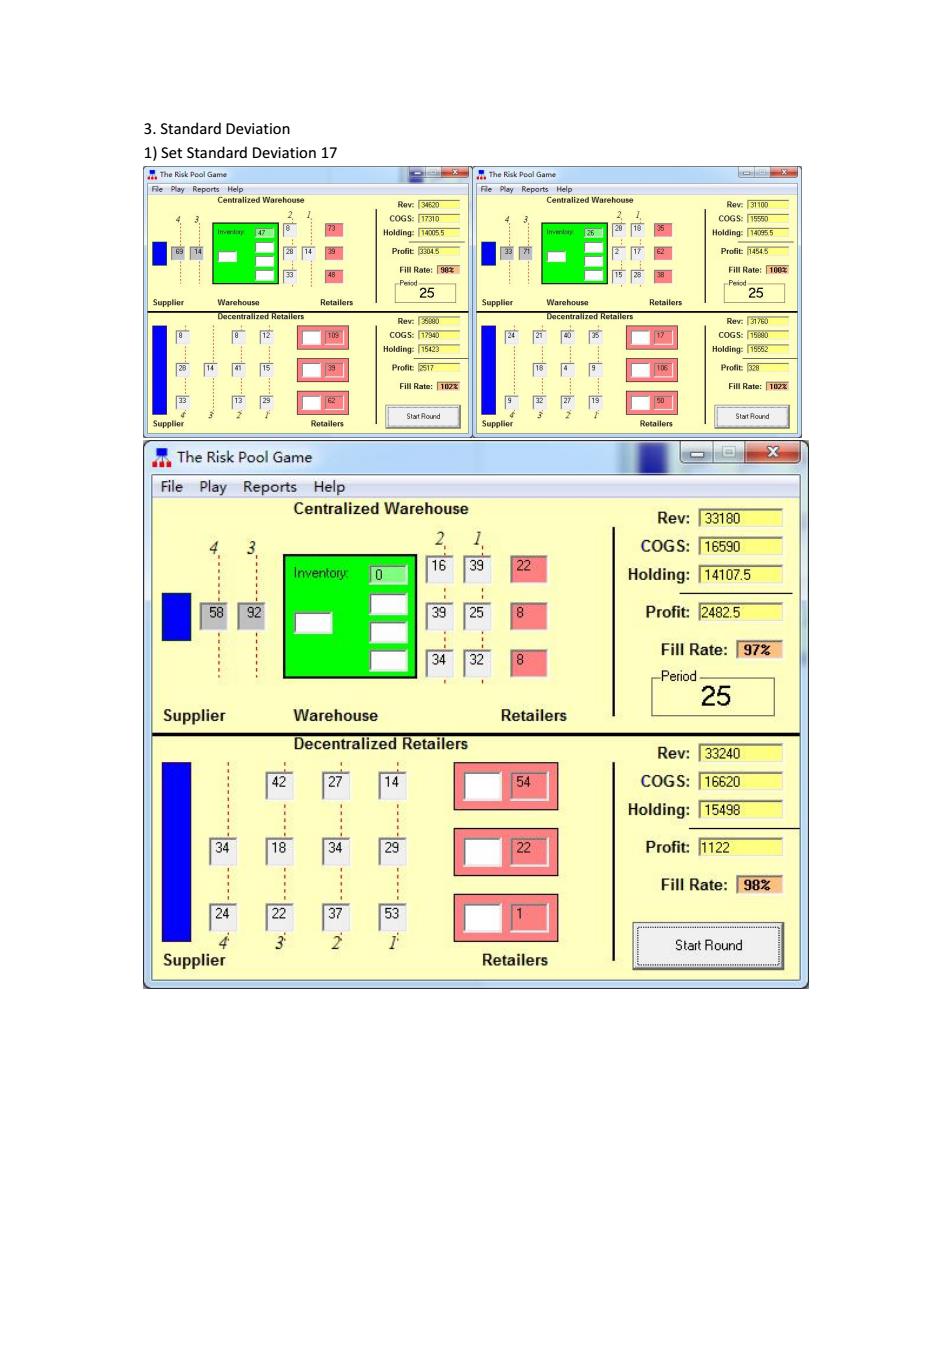
3.Standard Deviation 1)Set Standard Deviation 17 The Piak Pool Game ”The Riak Peol Game Re Play Reports Help entralized Warehouse Rev:[31520 Ra3100 C0GS:1730 C0GS:15550 73 Holding:140055 Holding:1455 Profit 454.5 Fi相Rate:[90a Fill Rate:100旺 25 25 Supplier Warehouse Retailers Warehouse Decentralized Retallers Rev:50 Decentralized Retallers Rev:3170 C0G575 Holding:15423 Holding:15562 Proft 328 Fill Rate:102 23 可 Stat Rounc Stat Round The Risk Pool Game X File Play Reports Help Centralized Warehouse Rev:33180 4 3 2 1 C0GS:16590 Inventory 0 16 39 22 Holding:14107.5 5892 39 25 8 Profit:2482.5 34 32 8 Fill Rate:97% Period 25 Supplier Warehouse Retailers Decentralized Retailers Rev:33240 42 27 M 54 C0GS:16620 Holding:15498 18 29 22 Profit:1122 Fill Rate::「98% 24 5 Start Round Supplier Retailers
3. Standard Deviation 1) Set Standard Deviation 17
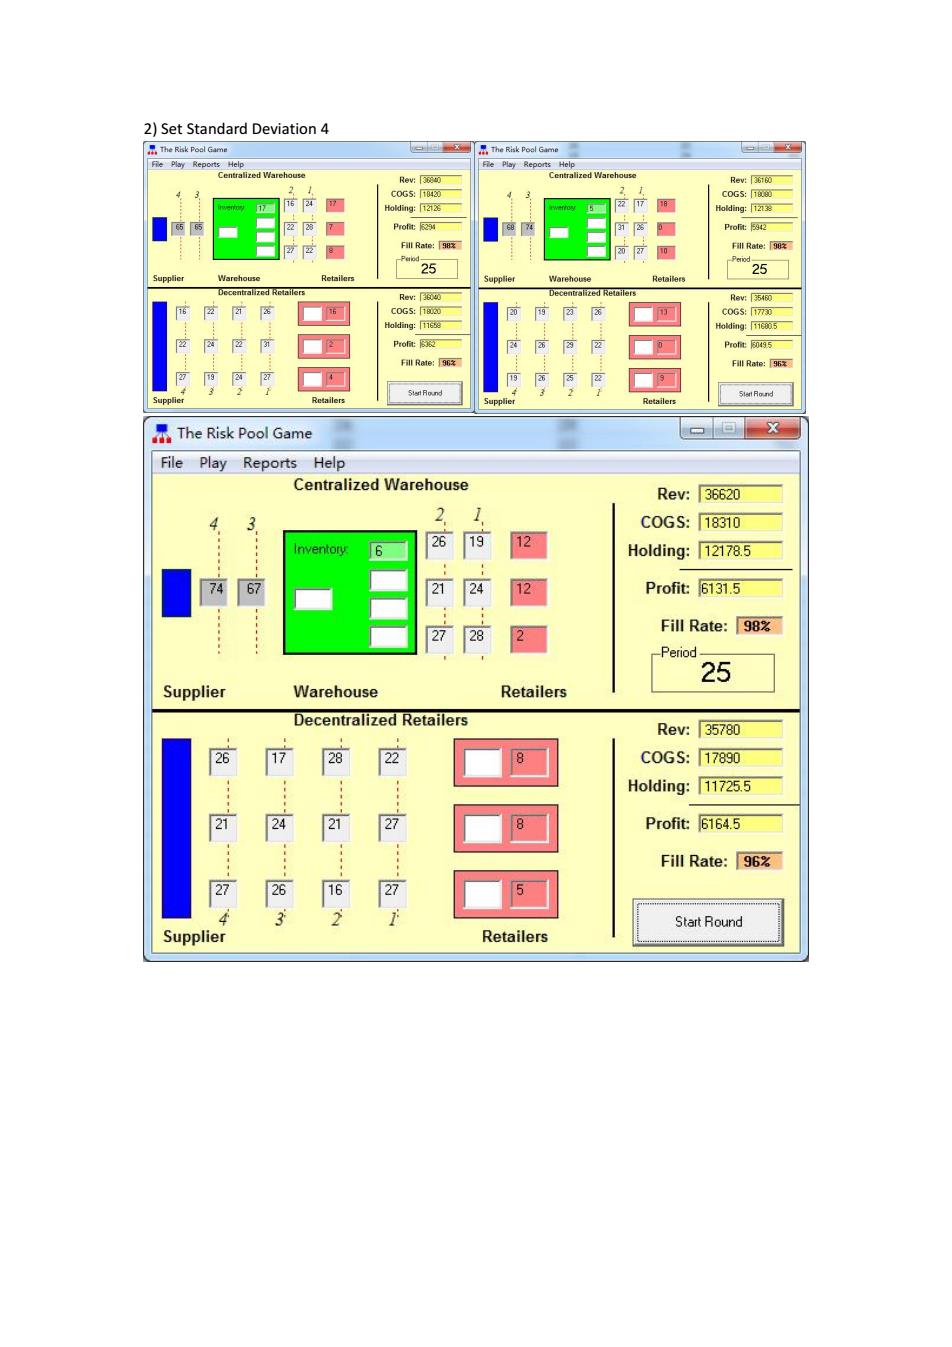
2)Set Standard Deviation 4 The Risk Poal Game The Risk Pool Game File Play Reports Help File Play Reports Help Centralized Warehouse Rev:[36840 Centralized Warehouse Rev:36160 C0G5:1840 COGS:[ Holding:1212 Holding:1213 Profit:254 西 Prolit:5342 图 Fll Rate: Fill Rate:90 Retailers 25 Warehou Supplier Warehouse Decentralized Retailers Rev: Decentralized Retailers Rev:3540 COGS:180 C0G5:17730 Holding:116005 Pot:3 Profit:0495 Fill Rate: Fill Rate: 9 Ster Round Start Round The Risk Pool Game X File Play Reports Help Centralized Warehouse Rev:36620 3 2 C0GS:18310 Inventory 26 /79 12 Holding:12178.5 7467 21 24 12 Profit:6131.5 27 28 2 Fill Rate:98% Period 25 Supplier Warehouse Retailers Decentralized Retailers ReV:35780 17 28 22 8 C0GS:17890 : Holding:11725.5 8 Profit:6164.5 Fill Rate:96% Start Round Supplier Retailers
2) Set Standard Deviation 4

Experiment Data: Default REV COGs Holding Profit FillRate Centralized 37260 18630 13077 5553 96 Decentralized 36900 18450 13497 4953 95 Centralized 34820 17410 13137 4273 98 Decentralized 34700 17350 13578 3772 98 Centralized 34360 17180 13086 4094 97 Decentralized 34420 17210 13521 3689 97 Demand Correlation Strong Positive REV COGS Holding Profit FillRate Centralized 37680 18840 12997.5 5842.5 Decentralized 38620 19310 13417.5 5892.5 97 Centralized 33680 16840 13159.5 3680.5 99 Decentralized 33840 16920 13587 3333 99 Centralized 29440 14720 13152 1568 98 Decentralized 29520 14760 13588.5 1171.5 99 Strong Negative REV CoGS Holding Profit FillRate Centralized 37180 18590 13035 5555 99 Decentralized 37360 18680 13516.5 5163.5 99 Centralized 36400 17700 13089 4611 98 Decentralized 35240 17620 13534.5 4085.5 97 Centralized 36720 18360 13075.5 5284.5 99 Decentralized 36520 18260 13540.5 4719.5 99 Standard Deviation Set Standard Deviation 17 REV COGS Holding Profit FillRate Centralized 34620 17310 14005.5 3304.5 98 Decentralized 35880 17940 15423 2517 102 Centralized 31100 15550 14095.5 1454.5 100 Decentralized 31760 15880 15552 328 102 Centralized 33180 16590 14107.5 2482.5 97 Decentralized 33240 16620 15498 1122 98 Set Standard Deviation 4
Experiment Data: Default Demand Correlation Strong Positive Strong Negative Standard Deviation Set Standard Deviation 17 Set Standard Deviation 4

REV COGS Holding Profit FillRate Centralized 36840 18420 12126 6294 98 Decentralized 36040 18020 11658 6362 96 Centralized 36160 18080 12138 5942 98 Decentralized 35460 17730 11680.5 6049.5 96 Centralized 36620 1831012178.5 6131.5 98 Decentralized 35780 17890 11725.5 6164.5 96 Question: 1.Why centralized system can reduce safety stock Centralizing inventory reduces both safety stock and average inventory in the system.Intuitively this is explained as follows.In a centralized distribution system, whenever demand from one market area is higher than average while demand in another market area is lower than average,items in the warehouse that were originally allocated for one market can be reallocated to the other.The process of reallocating inventory is not possible in a decentralized distribution system where different warehouses serve different markets. 2.Which kind of system is preferred when customer demand is easy to forecast? Which kind of system is preferred when customer demand varies strongly and is hard to forecast? When customer is easy to forecast,decentralized systems is preferred. The higher the coefficient of variation,the greater the benefit obtained from centralized systems;that is,the greater the benefit from risk pooling.Since reduction in average inventory is achieved mainly through a reduction in safety stock,the higher the coefficient of variation,the larger the impact of safety stock on inventory reduction. The benefits from risk pooling depend on the behavior of demand from one market relative to demand from another.We say that demand from two markets is positively correlated if it is very likely that whenever demand from one market is greater than average,demand from the other market is also greater than average.Similarly,when demand from one market is smaller than average,so is demand from the other.Intuitively,the benefit from risk pooling decreases as the correlation between demand from the two markets becomes more positive. 3.Using the answers to question 2,consider the following question: In reality,what kind of goods can be supplied through a centralized system? What kind of goods can be supplied through a decentralized system?Please place some examples. Digital cameras,computers,mobile phones can be supplied through a centralized system.Other refrigerators,ovens,some house necessary products can be supplied through a decentralized system. 4.In this experiment,we simulated a system who transformed two warehouses in
Question: 1. Why centralized system can reduce safety stock Centralizing inventory reduces both safety stock and average inventory in the system. Intuitively this is explained as follows. In a centralized distribution system, whenever demand from one market area is higher than average while demand in another market area is lower than average, items in the warehouse that were originally allocated for one market can be reallocated to the other. The process of reallocating inventory is not possible in a decentralized distribution system where different warehouses serve different markets. 2. Which kind of system is preferred when customer demand is easy to forecast? Which kind of system is preferred when customer demand varies strongly and is hard to forecast? When customer is easy to forecast, decentralized systems is preferred. The higher the coefficient of variation, the greater the benefit obtained from centralized systems; that is, the greater the benefit from risk pooling. Since reduction in average inventory is achieved mainly through a reduction in safety stock, the higher the coefficient of variation, the larger the impact of safety stock on inventory reduction. The benefits from risk pooling depend on the behavior of demand from one market relative to demand from another. We say that demand from two markets is positively correlated if it is very likely that whenever demand from one market is greater than average, demand from the other market is also greater than average. Similarly, when demand from one market is smaller than average, so is demand from the other. Intuitively, the benefit from risk pooling decreases as the correlation between demand from the two markets becomes more positive. 3. Using the answers to question 2, consider the following question: In reality, what kind of goods can be supplied through a centralized system? What kind of goods can be supplied through a decentralized system? Please place some examples. Digital cameras, computers, mobile phones can be supplied through a centralized system. Other refrigerators, ovens, some house necessary products can be supplied through a decentralized system. 4. In this experiment, we simulated a system who transformed two warehouses in
different states into one central warehouse,pooling each others'risk of high safety stock,which is a risk pooling in geographic dimension. Think of other ways of risk pooling in other dimensions such as time dimension relationship between different companies ect. Intergovernmental risk pools.IRPs provide alternative risk financing and transfer mechanisms to their members,through which particular types of risk are underwritten with contributions (premiums),with losses and expenses shared in agreed ratios.In other words, Intergovernmental Risk Pools are a cooperative group of governmental entities joining together to finance an exposure,liability or risk
different states into one central warehouse, pooling each others’ risk of high safety stock, which is a risk pooling in geographic dimension. Think of other ways of risk pooling in other dimensions such as time dimension relationship between different companies ect. Intergovernmental risk pools. IRPs provide alternative risk financing and transfer mechanisms to their members, through which particular types of risk are underwritten with contributions (premiums), with losses and expenses shared in agreed ratios. In other words, Intergovernmental Risk Pools are a cooperative group of governmental entities joining together to finance an exposure, liability or risk