正在加载图片...
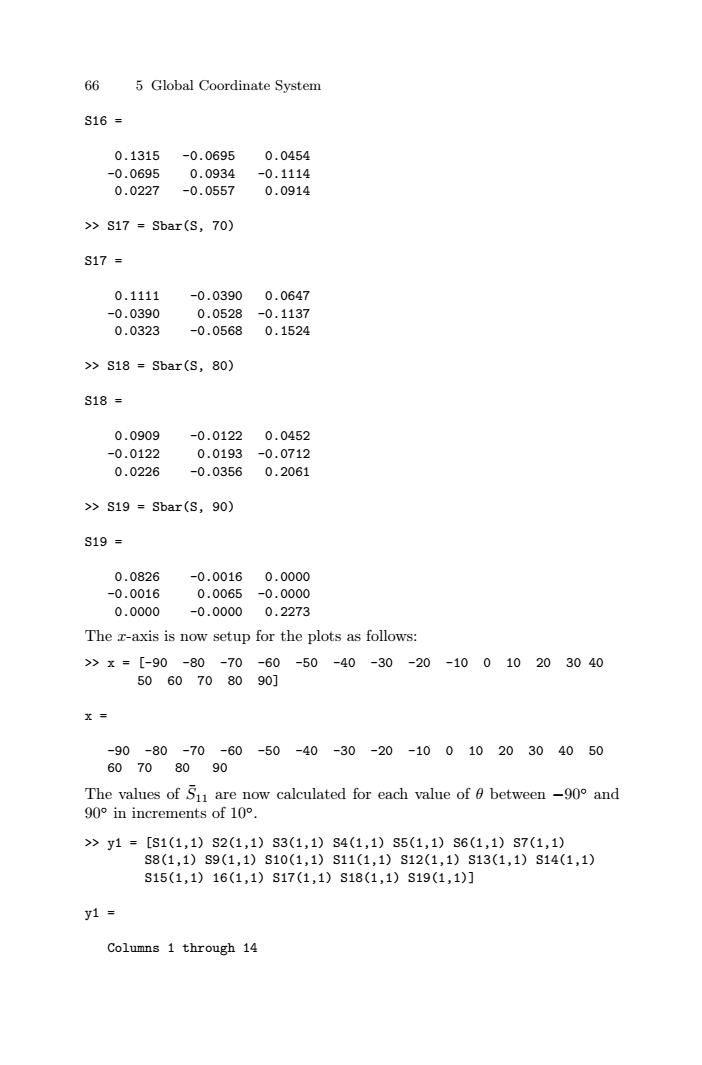
66 5 Global Coordinate System S16= 0.1315 -0.0695 0.0454 -0.0695 0.0934 -0.1114 0.0227 -0.0557 0.0914 >S17=Sbar(s,70) S17= 0.1111 -0.0390 0.0647 -0.0390 0.0528 -0.1137 0.0323 -0.0568 0.1524 >S18=Sbar(s,80) S18= 0.0909 -0.0122 0.0452 -0.0122 0.0193 -0.0712 0.0226 -0.0356 0.2061 >>s19=sbar(s,90) S19= 0.0826 -0.0016 0.0000 -0.0016 0.0065 -0.0000 0.0000 -0.0000 0.2273 The z-axis is now setup for the plots as follows: >x=[-90-80-70-60-50-40-30-20-10010203040 5060708090] X -90-80-70-60-50-40-30-20-1001020304050 60708090 The values of 5u1 are now calculated for each value of 0 between-90 and 90°in increments of10°. >y1=[S1(1,1)S2(1,1)S3(1,1)S4(1,1)S5(1,1)S6(1,1)S7(1,1) S8(1,1)S9(1,1)S10(1,1)S11(1,1)S12(1,1)S13(1,1)S14(1,1) S15(1,1)16(1,1)S17(1,1)S18(1,1)S19(1,1)] y1= Columns 1 through 1466 5 Global Coordinate System S16 = 0.1315 -0.0695 0.0454 -0.0695 0.0934 -0.1114 0.0227 -0.0557 0.0914 >> S17 = Sbar(S, 70) S17 = 0.1111 -0.0390 0.0647 -0.0390 0.0528 -0.1137 0.0323 -0.0568 0.1524 >> S18 = Sbar(S, 80) S18 = 0.0909 -0.0122 0.0452 -0.0122 0.0193 -0.0712 0.0226 -0.0356 0.2061 >> S19 = Sbar(S, 90) S19 = 0.0826 -0.0016 0.0000 -0.0016 0.0065 -0.0000 0.0000 -0.0000 0.2273 The x-axis is now setup for the plots as follows: >> x = [-90 -80 -70 -60 -50 -40 -30 -20 -10 0 10 20 30 40 50 60 70 80 90] x = -90 -80 -70 -60 -50 -40 -30 -20 -10 0 10 20 30 40 50 60 70 80 90 The values of S¯11 are now calculated for each value of θ between −90◦ and 90◦ in increments of 10◦. >> y1 = [S1(1,1) S2(1,1) S3(1,1) S4(1,1) S5(1,1) S6(1,1) S7(1,1) S8(1,1) S9(1,1) S10(1,1) S11(1,1) S12(1,1) S13(1,1) S14(1,1) S15(1,1) 16(1,1) S17(1,1) S18(1,1) S19(1,1)] y1 = Columns 1 through 14