正在加载图片...
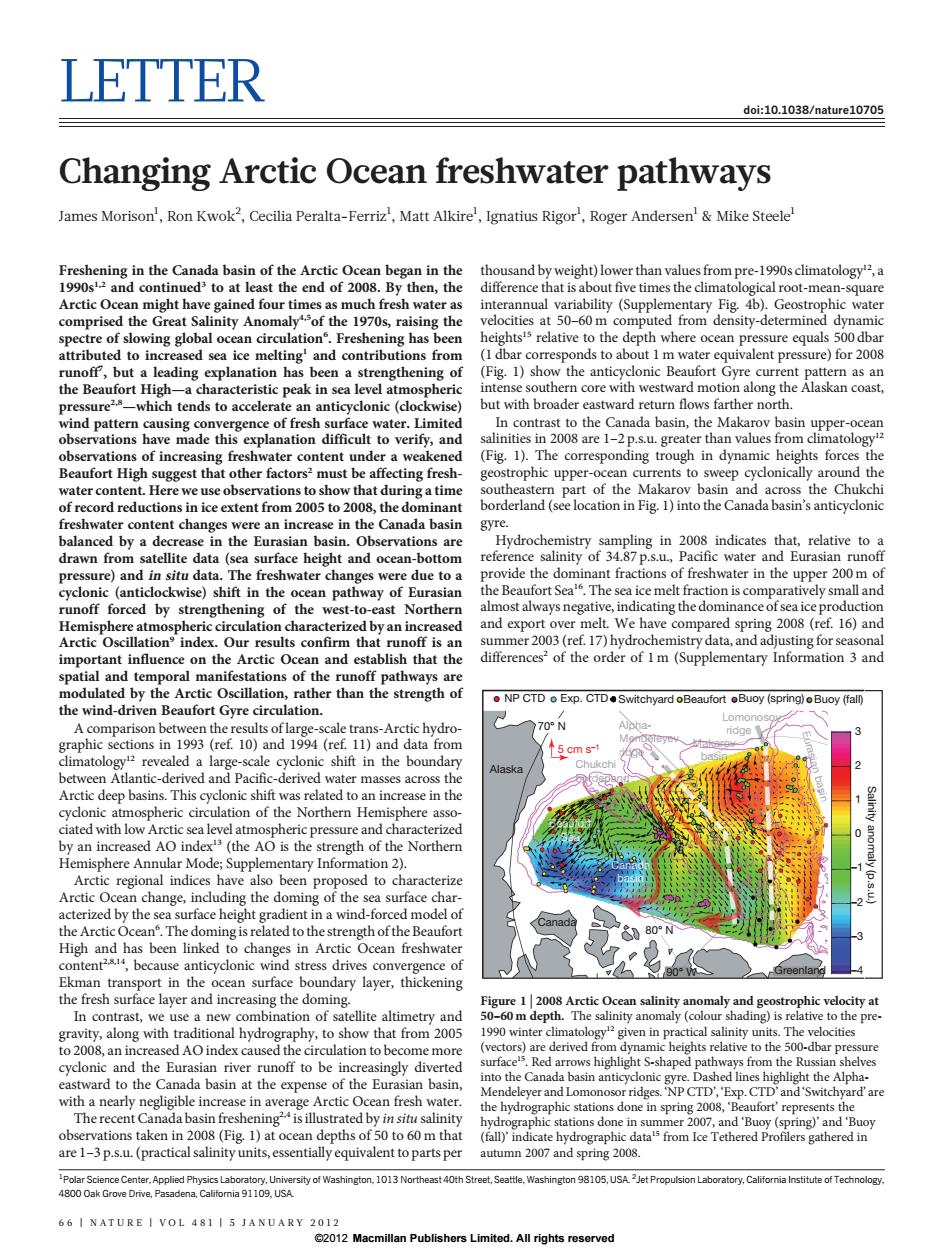
LETTER doi:10.1038/nature10705 Changing Arctic Ocean freshwater pathways James Morison',Ron Kwok2,Cecilia Peralta-Ferriz,Matt Alkire',Ignatius Rigor,Roger Andersen'&Mike Steele Freshening in the Canada basin of the Arctic Ocean began in the thousand by weight)lower than values from pre-1990s climatology2,a 1990s12 and continueds to at least the end of 2008.By then,the difference that is about five times the climatological root-mean-square Arctic Ocean might have gained four times as much fresh water as interannual variability (Supplementary Fig.4b).Geostrophic water comprised the Great Salinity Anomaly of the 1970s,raising the velocities at 50-60 m computed from density-determined dynamic spectre of slowing global ocean circulation.Freshening has been heights's relative to the depth where ocean pressure equals 500 dbar attributed to increased sea ice melting'and contributions from (1 dbar corresponds to about 1 m water equivalent pressure)for 2008 runoff,but a leading explanation has been a strengthening of (Fig.1)show the anticyclonic Beaufort Gyre current pattern as an the Beaufort High-a characteristic peak in sea level atmospheric intense southern core with westward motion along the Alaskan coast, pressure2-which tends to accelerate an anticyclonic(clockwise) but with broader eastward return flows farther north wind pattern causing convergence of fresh surface water.Limited In contrast to the Canada basin,the Makarov basin upper-ocean observations have made this explanation difficult to verify,and salinities in 2008 are 1-2p.s.u.greater than values from climatology2 observations of increasing freshwater content under a weakened (Fig.1).The corresponding trough in dynamic heights forces the Beaufort High suggest that other factors?must be affecting fresh- geostrophic upper-ocean currents to sweep cyclonically around the water content.Here we use observations to show that during a time southeastern part of the Makarov basin and across the Chukchi of record reductions in ice extent from 2005 to 2008,the dominant borderland (see location in Fig.1)into the Canada basin's anticyclonic freshwater content changes were an increase in the Canada basin gyre. balanced by a decrease in the Eurasian basin.Observations are Hydrochemistry sampling in 2008 indicates that,relative to a drawn from satellite data (sea surface height and ocean-bottom reference salinity of 34.87 p.s.u.,Pacific water and Eurasian runoff pressure)and in situ data.The freshwater changes were due to a provide the dominant fractions of freshwater in the upper 200 m of cyclonic(anticlockwise)shift in the ocean pathway of Eurasian the Beaufort Sea.The sea ice melt fraction is comparatively small and runoff forced by strengthening of the west-to-east Northern almost always negative,indicating the dominance of sea ice production Hemisphere atmospheric circulation characterized by an increased and export over melt.We have compared spring 2008(ref.16)and Arctic Oscillation index.Our results confirm that runoff is an summer 2003(ref.17)hydrochemistry data,and adjusting for seasonal important influence on the Arctic Ocean and establish that the differences2 of the order of 1m(Supplementary Information 3 and spatial and temporal manifestations of the runoff pathways are modulated by the Arctic Oscillation,rather than the strength of o NP CTD o Exp.CTD.Switchyard oBeaufort oBuoy (spring)oBuoy (fall) the wind-driven Beaufort Gyre circulation. A comparison between the results of large-scale trans-Arctic hydro- 70N graphic sections in 1993 (ref.10)and 1994 (ref.11)and data from climatology revealed a large-scale cyclonic shift in the boundary Alask between Atlantic-derived and Pacific-derived water masses across the Arctic deep basins.This cyclonic shift was related to an increase in the cyclonic atmospheric circulation of the Northern Hemisphere asso- ciated with low Arctic sea level atmospheric pressure and characterized by an increased AO index'3(the AO is the strength of the Northern Hemisphere Annular Mode;Supplementary Information 2). Arctic regional indices have also been proposed to characterize Salinity anomaly (p.s.u. Arctic Ocean change,including the doming of the sea surface char- acterized by the sea surface height gradient in a wind-forced model of the Arctic Ocean.The doming is related to the strength ofthe Beaufort High and has been linked to changes in Arctic Ocean freshwater content24,because anticyclonic wind stress drives convergence of Ekman transport in the ocean surface boundary layer,thickening the fresh surface layer and increasing the doming. Figure 1 2008 Arctic Ocean salinity anomaly and geostrophic velocity at In contrast,we use a new combination of satellite altimetry and 50-60 m depth.The salinity anomaly(colour shading)is relative to the pre- gravity,along with traditional hydrography,to show that from 2005 1990 winter climatology2given in practical salinity units.The velocities to 2008,an increased AO index caused the circulation to become more (vectors)are derived from dynamic heights relative to the 500-dbar pressure cyclonic and the Eurasian river runoff to be increasingly diverted surface5.Red arrows highlight S-shaped pathways from the Russian shelves eastward to the Canada basin at the expense of the Eurasian basin, into the Canada basin anticyclonic gyre.Dashed lines highlight the Alpha- Mendeleyer and Lomonosor ridges.'NP CTD','Exp.CTD'and'Switchyard'are with a nearly negligible increase in average Arctic Ocean fresh water. the hydrographic stations done in spring 2008,'Beaufort'represents the The recent Canada basin fresheningis illustrated by in situ salinity hydrographic stations done in summer 2007,and 'Buoy(spring)'and 'Buoy observations taken in 2008(Fig.1)at ocean depths of 50 to 60 m that (fall)'indicate hydrographic data's from Ice Tethered Profilers gathered in are 1-3 p.s.u.(practical salinity units,essentially equivalent to parts per autumn 2007 and spring 2008. PoarScience Center.Applied Physics Laboratory.University of Washington.1013 Northeast 40th Street,Seattle,Washington9105,USAet Propulsion Laboratory,California Institute of Technology. 4800 Oak Grove Drive,Pasadena,Califomia 91109,USA 66INATURE I VOL 481I5 JANUARY 2012 2012 Macmillan Publishers Limited.All rights reservedLETTER doi:10.1038/nature10705 Changing Arctic Ocean freshwater pathways James Morison1 , Ron Kwok2 , Cecilia Peralta-Ferriz1 , Matt Alkire1 , Ignatius Rigor1 , Roger Andersen1 & Mike Steele1 Freshening in the Canada basin of the Arctic Ocean began in the 1990s1,2 and continued3 to at least the end of 2008. By then, the Arctic Ocean might have gained four times as much fresh water as comprised the Great Salinity Anomaly4,5of the 1970s, raising the spectre of slowing global ocean circulation6 . Freshening has been attributed to increased sea ice melting1 and contributions from runoff7 , but a leading explanation has been a strengthening of the Beaufort High—a characteristic peak in sea level atmospheric pressure2,8—which tends to accelerate an anticyclonic (clockwise) wind pattern causing convergence of fresh surface water. Limited observations have made this explanation difficult to verify, and observations of increasing freshwater content under a weakened Beaufort High suggest that other factors2 must be affecting freshwater content. Here we use observations to show that during a time of record reductions in ice extent from 2005 to 2008, the dominant freshwater content changes were an increase in the Canada basin balanced by a decrease in the Eurasian basin. Observations are drawn from satellite data (sea surface height and ocean-bottom pressure) and in situ data. The freshwater changes were due to a cyclonic (anticlockwise) shift in the ocean pathway of Eurasian runoff forced by strengthening of the west-to-east Northern Hemisphere atmospheric circulation characterized by an increased Arctic Oscillation9 index. Our results confirm that runoff is an important influence on the Arctic Ocean and establish that the spatial and temporal manifestations of the runoff pathways are modulated by the Arctic Oscillation, rather than the strength of the wind-driven Beaufort Gyre circulation. A comparison between the results of large-scale trans-Arctic hydrographic sections in 1993 (ref. 10) and 1994 (ref. 11) and data from climatology12 revealed a large-scale cyclonic shift in the boundary between Atlantic-derived and Pacific-derived water masses across the Arctic deep basins. This cyclonic shift was related to an increase in the cyclonic atmospheric circulation of the Northern Hemisphere associated with low Arctic sea level atmospheric pressure and characterized by an increased AO index13 (the AO is the strength of the Northern Hemisphere Annular Mode; Supplementary Information 2). Arctic regional indices have also been proposed to characterize Arctic Ocean change, including the doming of the sea surface characterized by the sea surface height gradient in a wind-forced model of the Arctic Ocean6 . The doming is related to the strength of the Beaufort High and has been linked to changes in Arctic Ocean freshwater content2,8,14, because anticyclonic wind stress drives convergence of Ekman transport in the ocean surface boundary layer, thickening the fresh surface layer and increasing the doming. In contrast, we use a new combination of satellite altimetry and gravity, along with traditional hydrography, to show that from 2005 to 2008, an increased AO index caused the circulation to become more cyclonic and the Eurasian river runoff to be increasingly diverted eastward to the Canada basin at the expense of the Eurasian basin, with a nearly negligible increase in average Arctic Ocean fresh water. The recent Canada basin freshening2,4 is illustrated by in situ salinity observations taken in 2008 (Fig. 1) at ocean depths of 50 to 60 m that are 1–3 p.s.u. (practical salinity units, essentially equivalent to parts per thousand by weight) lower than values from pre-1990s climatology12, a difference that is about five times the climatological root-mean-square interannual variability (Supplementary Fig. 4b). Geostrophic water velocities at 50–60 m computed from density-determined dynamic heights15 relative to the depth where ocean pressure equals 500 dbar (1 dbar corresponds to about 1 m water equivalent pressure) for 2008 (Fig. 1) show the anticyclonic Beaufort Gyre current pattern as an intense southern core with westward motion along the Alaskan coast, but with broader eastward return flows farther north. In contrast to the Canada basin, the Makarov basin upper-ocean salinities in 2008 are 1–2 p.s.u. greater than values from climatology12 (Fig. 1). The corresponding trough in dynamic heights forces the geostrophic upper-ocean currents to sweep cyclonically around the southeastern part of the Makarov basin and across the Chukchi borderland (see location in Fig. 1) into the Canada basin’s anticyclonic gyre. Hydrochemistry sampling in 2008 indicates that, relative to a reference salinity of 34.87 p.s.u., Pacific water and Eurasian runoff provide the dominant fractions of freshwater in the upper 200 m of the Beaufort Sea16. The sea ice melt fraction is comparatively small and almost always negative, indicating the dominance of sea ice production and export over melt. We have compared spring 2008 (ref. 16) and summer 2003 (ref. 17) hydrochemistry data, and adjusting for seasonal differences2 of the order of 1 m (Supplementary Information 3 and 1 Polar Science Center, Applied Physics Laboratory, University of Washington, 1013 Northeast 40th Street, Seattle, Washington 98105, USA. 2 Jet Propulsion Laboratory, California Institute of Technology, 4800 Oak Grove Drive, Pasadena, California 91109, USA. Alaska –4 –3 –2 –1 0 1 2 3 Canada 70° N 5 cm s–1 90° W Greenland 80° N Canada basin Eurasian basin Makarov basin NP CTD Exp. CTD Switchyard Beaufort Buoy (spring) Buoy (fall) AlphaMendeleyev ridge Lomonosov ridge Beaufort Sea Chukchi borderland Salinity anomaly (p.s.u.) Figure 1 | 2008 Arctic Ocean salinity anomaly and geostrophic velocity at 50–60 m depth. The salinity anomaly (colour shading) is relative to the pre- 1990 winter climatology12 given in practical salinity units. The velocities (vectors) are derived from dynamic heights relative to the 500-dbar pressure surface15. Red arrows highlight S-shaped pathways from the Russian shelves into the Canada basin anticyclonic gyre. Dashed lines highlight the AlphaMendeleyer and Lomonosor ridges. ‘NP CTD’, ‘Exp. CTD’ and ‘Switchyard’ are the hydrographic stations done in spring 2008, ‘Beaufort’ represents the hydrographic stations done in summer 2007, and ‘Buoy (spring)’ and ‘Buoy (fall)’ indicate hydrographic data15 from Ice Tethered Profilers gathered in autumn 2007 and spring 2008. 66 | NATURE | VOL 481 | 5 JANUARY 2012 ©2012 Macmillan Publishers Limited. All rights reserved