正在加载图片...
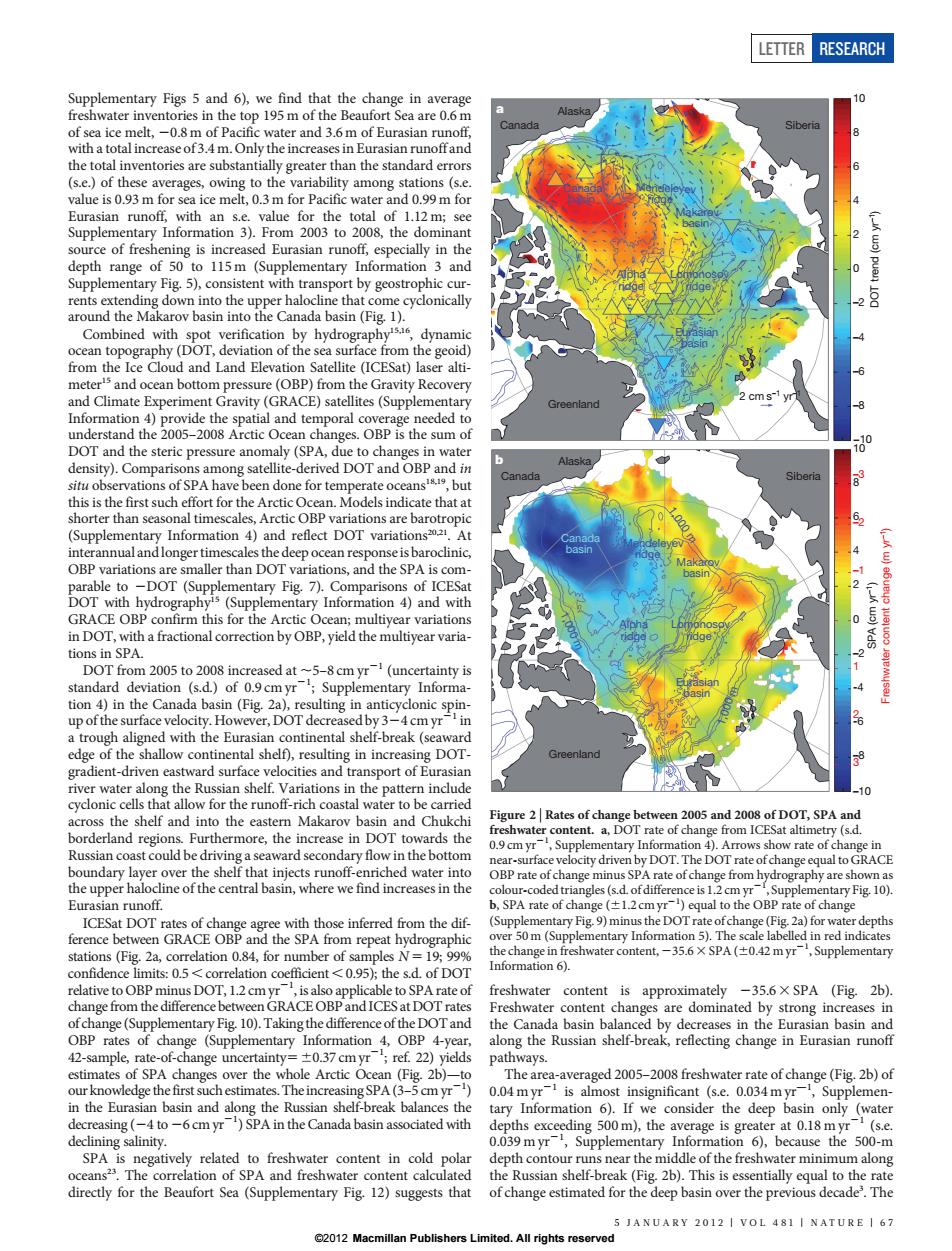
LETTER RESEARCH Supplementary Figs 5 and 6),we find that the change in average freshwater inventories in the top 195 m of the Beaufort Sea are 0.6m Alask anada of sea ice melt,-0.8 m of Pacific water and 3.6 m of Eurasian runoff Siberia with a total increase of3.4 m.Only the increases in Eurasian runoffand the total inventories are substantially greater than the standard errors (s.e.)of these averages,owing to the variability among stations (s.e. value is 0.93 m for sea ice melt,0.3 m for Pacific water and 0.99 m for Eurasian runoff,with an s.e.value for the total of 1.12 m;see Supplementary Information 3).From 2003 to 2008,the dominant source of freshening is increased Eurasian runoff,especially in the depth range of 50 to 115m (Supplementary Information 3 and Supplementary Fig.5),consistent with transport by geostrophic cur- rents extending down into the upper halocline that come cyclonically around the Makarov basin into the Canada basin(Fig.1). Combined with spot verification by hydrographyise,dynamic ocean topography(DOT,deviation of the sea surface from the geoid) from the Ice Cloud and Land Elevation Satellite (ICESat)laser alti meter's and ocean bottom pressure(OBP)from the Gravity Recovery and Climate Experiment Gravity(GRACE)satellites(Supplementary cms Information 4)provide the spatial and temporal coverage needed to understand the 2005-2008 Arctic Ocean changes.OBP is the sum of DOT and the steric pressure anomaly (SPA,due to changes in water density).Comparisons among satellite-derived DOT and OBP and in situ observations of SPA have been done for temperate oceans but Siberia this is the first such effort for the Arctic Ocean.Models indicate that at shorter than seasonal timescales,Arctic OBP variations are barotropic (Supplementary Information 4)and reflect DOT variations2021.At interannual and longer timescales the deep ocean response is baroclinic, OBP variations are smaller than DOT variations,and the SPA is com- parable to-DOT (Supplementary Fig.7).Comparisons of ICESat DOT with hydrography's (Supplementary Information 4)and with GRACE OBP confirm this for the Arctic Ocean;multiyear variations in DOT,with a fractional correction by OBP,yield the multiyear varia- tions in SPA DOT from 2005 to 2008 increased at~5-8 cm yr(uncertainty is 1 standard deviation (s.d.)of 0.9cmyr;Supplementary Informa- 4 tion 4)in the Canada basin (Fig.2a),resulting in anticyclonic spin- up of the surface velocity.However,DOT decreasedby3-4cmyrin a trough aligned with the Eurasian continental shelf-break(seaward edge of the shallow continental shelf),resulting in increasing DOT- Greenland gradient-driven eastward surface velocities and transport of Eurasian river water along the Russian shelf.Variations in the pattern include 10 cyclonic cells that allow for the runoff-rich coastal water to be carried across the shelf and into the eastern Makarov basin and Chukchi Figure 2 Rates of change between 2005 and 2008 of DOT,SPA and freshwater content.a,DOT rate of change from ICESat altimetry (s.d. borderland regions.Furthermore,the increase in DOT towards the Russian coast could be driving a seaward secondary flow in the bottom 0.9cmyr-Supplementary Information 4).Arrows show rate of change in near-surface velocity driven by DOT.The DOT rate of change equal to GRACE boundary layer over the shelf that injects runoff-enriched water into OBP rate of change minus SPA rate of change from hydrography are shown as the upper halocline of the central basin,where we find increases in the colour-coded triangles(s.d.ofdifference is 1.2 cm yr,Supplementary Fig.10). Eurasian runoff. b,SPA rate of change(+1.2cmyr)equal to the OBP rate of change ICESat DOT rates of change agree with those inferred from the dif- (Supplementary Fig.9)minus the DOTrate ofchange(Fig.2a)for water depths ference between GRACE OBP and the SPA from repeat hydrographic over 50m(Supplementary Information 5).The scale labelled in red indicates stations (Fig.2a,correlation 0.84,for number of samples N=19;99% the change in freshwater content,-35.6 X SPA(+0.42 m yr,Supplementary confidence limits:0.5<correlation coefficient <0.95);the s.d.of DOT Information 6). relative to OBP minus DOT,1.2 cmyr,is also applicable to SPA rate of freshwater content is approximately -35.6X SPA (Fig.2b). change from the difference between GRACE OBP and ICES at DOT rates Freshwater content changes are dominated by strong increases in of change(Supplementary Fig.10).Taking the difference of the DOTand the Canada basin balanced by decreases in the Eurasian basin and OBP rates of change (Supplementary Information 4,OBP 4-year, along the Russian shelf-break,reflecting change in Eurasian runoff 42-sample,rate-of-change uncertainty=+0.37 cmyr;ref.22)yields pathways. estimates of SPA changes over the whole Arctic Ocean (Fig.2b)-to The area-averaged 2005-2008 freshwater rate of change(Fig.2b)of our knowledge the first suchestimates.TheincreasingSPA(3-5cmyr)0.04myr-is almost insignificant (s.e.0.034myr-,Supplemen- in the Eurasian basin and along the Russian shelf-break balances the tary Information 6).If we consider the deep basin only (water decreasing(-4 to-6cmyr)SPA in the Canada basin associated with depths exceeding 500m),the average is greater at 0.18 myr(s.e. declining salinity. 0.039myr,Supplementary Information 6),because the 500-m SPA is negatively related to freshwater content in cold polar depth contour runs near the middle of the freshwater minimum along oceans23.The correlation of SPA and freshwater content calculated the Russian shelf-break(Fig.2b).This is essentially equal to the rate directly for the Beaufort Sea(Supplementary Fig.12)suggests that of change estimated for the deep basin over the previous decade'.The 5 JANUARY 2012 VOL 481I NATURE 67 2012 Macmillan Publishers Limited.All rights reservedSupplementary Figs 5 and 6), we find that the change in average freshwater inventories in the top 195 m of the Beaufort Sea are 0.6 m of sea ice melt, 20.8 m of Pacific water and 3.6 m of Eurasian runoff, with a total increase of 3.4 m. Only the increases in Eurasian runoff and the total inventories are substantially greater than the standard errors (s.e.) of these averages, owing to the variability among stations (s.e. value is 0.93 m for sea ice melt, 0.3 m for Pacific water and 0.99 m for Eurasian runoff, with an s.e. value for the total of 1.12 m; see Supplementary Information 3). From 2003 to 2008, the dominant source of freshening is increased Eurasian runoff, especially in the depth range of 50 to 115 m (Supplementary Information 3 and Supplementary Fig. 5), consistent with transport by geostrophic currents extending down into the upper halocline that come cyclonically around the Makarov basin into the Canada basin (Fig. 1). Combined with spot verification by hydrography15,16, dynamic ocean topography (DOT, deviation of the sea surface from the geoid) from the Ice Cloud and Land Elevation Satellite (ICESat) laser altimeter15 and ocean bottom pressure (OBP) from the Gravity Recovery and Climate Experiment Gravity (GRACE) satellites (Supplementary Information 4) provide the spatial and temporal coverage needed to understand the 2005–2008 Arctic Ocean changes. OBP is the sum of DOT and the steric pressure anomaly (SPA, due to changes in water density). Comparisons among satellite-derived DOT and OBP and in situ observations of SPA have been done for temperate oceans18,19, but this is the first such effort for the Arctic Ocean. Models indicate that at shorter than seasonal timescales, Arctic OBP variations are barotropic (Supplementary Information 4) and reflect DOT variations20,21. At interannual and longer timescales the deep ocean response is baroclinic, OBP variations are smaller than DOT variations, and the SPA is comparable to 2DOT (Supplementary Fig. 7). Comparisons of ICESat DOT with hydrography15 (Supplementary Information 4) and with GRACE OBP confirm this for the Arctic Ocean; multiyear variations in DOT, with a fractional correction by OBP, yield the multiyear variations in SPA. DOT from 2005 to 2008 increased at ,5–8 cm yr21 (uncertainty is standard deviation (s.d.) of 0.9 cm yr21 ; Supplementary Information 4) in the Canada basin (Fig. 2a), resulting in anticyclonic spinup of the surface velocity. However, DOT decreased by 324 cm yr21 in a trough aligned with the Eurasian continental shelf-break (seaward edge of the shallow continental shelf), resulting in increasing DOTgradient-driven eastward surface velocities and transport of Eurasian river water along the Russian shelf. Variations in the pattern include cyclonic cells that allow for the runoff-rich coastal water to be carried across the shelf and into the eastern Makarov basin and Chukchi borderland regions. Furthermore, the increase in DOT towards the Russian coast could be driving a seaward secondary flow in the bottom boundary layer over the shelf that injects runoff-enriched water into the upper halocline of the central basin, where we find increases in the Eurasian runoff. ICESat DOT rates of change agree with those inferred from the difference between GRACE OBP and the SPA from repeat hydrographic stations (Fig. 2a, correlation 0.84, for number of samples N 5 19; 99% confidence limits: 0.5 , correlation coefficient , 0.95); the s.d. of DOT relative to OBP minus DOT, 1.2 cm yr21 , is also applicable to SPA rate of changefrom the difference between GRACE OBP and ICES at DOT rates of change (Supplementary Fig. 10). Taking the difference of the DOT and OBP rates of change (Supplementary Information 4, OBP 4-year, 42-sample, rate-of-change uncertainty5 60.37 cm yr21 ; ref. 22) yields estimates of SPA changes over the whole Arctic Ocean (Fig. 2b)—to our knowledge thefirst such estimates. Theincreasing SPA (3–5 cm yr21 ) in the Eurasian basin and along the Russian shelf-break balances the decreasing (24 to 26 cm yr21 ) SPA in the Canada basin associated with declining salinity. SPA is negatively related to freshwater content in cold polar oceans23. The correlation of SPA and freshwater content calculated directly for the Beaufort Sea (Supplementary Fig. 12) suggests that freshwater content is approximately 235.6 3 SPA (Fig. 2b). Freshwater content changes are dominated by strong increases in the Canada basin balanced by decreases in the Eurasian basin and along the Russian shelf-break, reflecting change in Eurasian runoff pathways. The area-averaged 2005–2008 freshwater rate of change (Fig. 2b) of 0.04 m yr21 is almost insignificant (s.e. 0.034 m yr—1, Supplementary Information 6). If we consider the deep basin only (water depths exceeding 500 m), the average is greater at 0.18 m yr21 (s.e. 0.039 m yr21 , Supplementary Information 6), because the 500-m depth contour runs near the middle of the freshwater minimum along the Russian shelf-break (Fig. 2b). This is essentially equal to the rate of change estimated for the deep basin over the previous decade3 . The Alpha ridge Lomonosov ridge Mendeleyev ridge Canada basin Makarov basin Eurasian basin Greenland Siberia Alaska Canada 2 cm s–1 yr–1 −10 –8 –6 –4 –2 0 2 4 6 8 10 a Alpha ridge Lomonosov ridge Mendeleyev ridge Canada basin Makarov basin Eurasian basin Greenland Siberia Alaska Canada SPA (cm yr–1) Freshwater content change (m yr–1) DOT trend (cm yr–1) –10 –8 -6 -4 –2 0 2 4 6 8 10 3 2 1 –1 –2 –3 b 1,000 m 1,000 m 1,000 m Figure 2 | Rates of change between 2005 and 2008 of DOT, SPA and freshwater content. a, DOT rate of change from ICESat altimetry (s.d. 0.9 cm yr21 , Supplementary Information 4). Arrows show rate of change in near-surface velocity driven by DOT. The DOT rate of change equal to GRACE OBP rate of change minus SPA rate of change from hydrography are shown as colour-coded triangles (s.d. of difference is 1.2 cm yr21 , Supplementary Fig. 10). b, SPA rate of change (61.2 cm yr21 ) equal to the OBP rate of change (Supplementary Fig. 9) minus the DOT rate of change (Fig. 2a) for water depths over 50 m (Supplementary Information 5). The scale labelled in red indicates the change in freshwater content, 235.6 3 SPA (60.42 m yr21 , Supplementary Information 6). LETTER RESEARCH 5 JANUARY 2012 | VOL 481 | NATURE | 67 ©2012 Macmillan Publishers Limited. All rights reserved