正在加载图片...
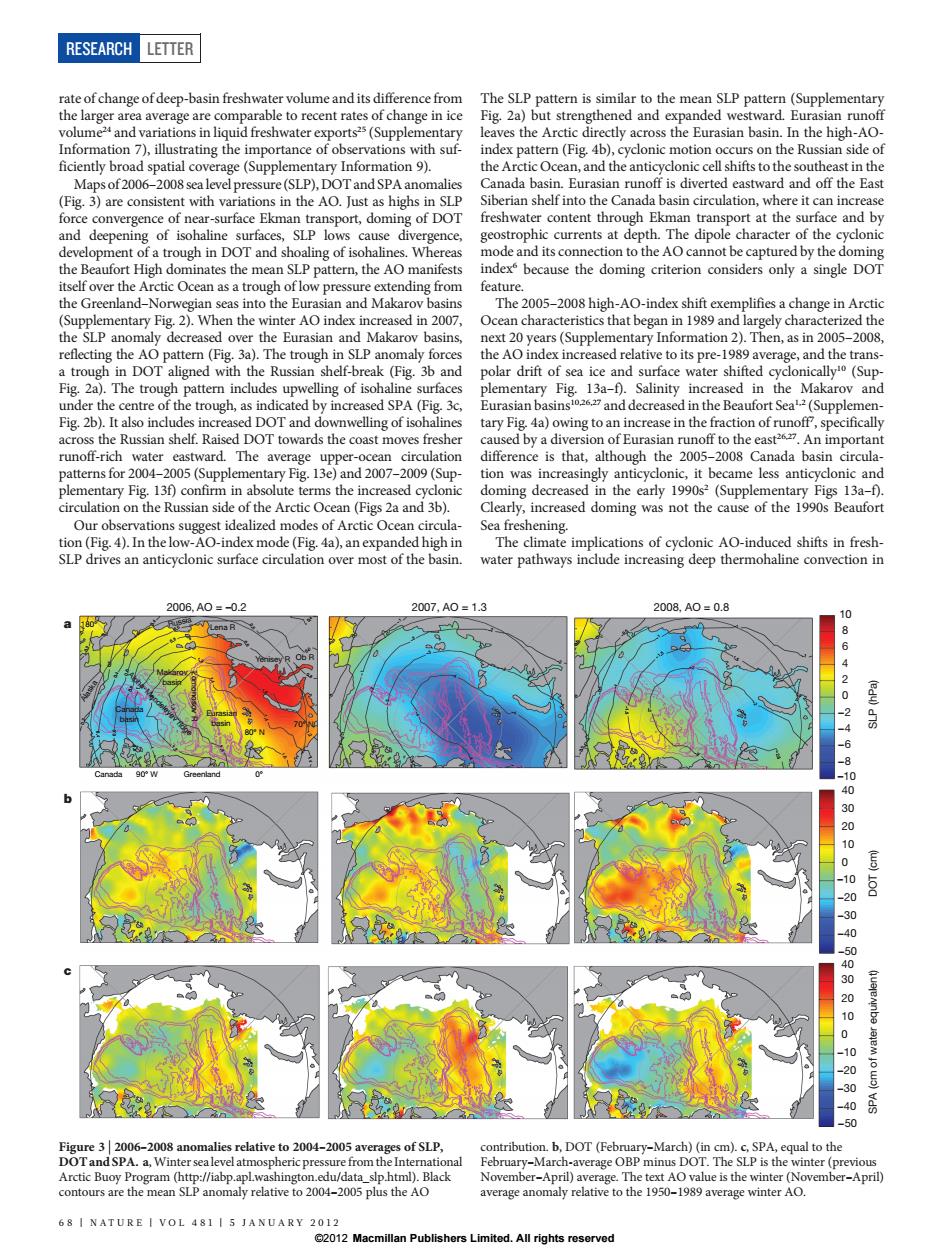
RESEARCH LETTER rate of change of deep-basin freshwater volume and its difference from The SLP pattern is similar to the mean SLP pattern(Supplementary the larger area average are comparable to recent rates of change in ice Fig.2a)but strengthened and expanded westward.Eurasian runoff volume2and variations in liquid freshwater exports2s(Supplementary leaves the Arctic directly across the Eurasian basin.In the high-AO- Information 7),illustrating the importance of observations with suf- index pattern(Fig.4b),cyclonic motion occurs on the Russian side of ficiently broad spatial coverage(Supplementary Information 9). the Arctic Ocean,and the anticyclonic cell shifts to the southeast in the Maps of 2006-2008 sea level pressure(SLP),DOT and SPA anomalies Canada basin.Eurasian runoff is diverted eastward and off the East (Fig.3)are consistent with variations in the AO.Just as highs in SLP Siberian shelf into the Canada basin circulation,where it can increase force convergence of near-surface Ekman transport,doming of DOT freshwater content through Ekman transport at the surface and by and deepening of isohaline surfaces,SLP lows cause divergence, geostrophic currents at depth.The dipole character of the cyclonic development of a trough in DOT and shoaling of isohalines.Whereas mode and its connection to the AO cannot be captured by the doming the Beaufort High dominates the mean SLP pattern,the AO manifests indexe because the doming criterion considers only a single DOT itself over the Arctic Ocean as a trough of low pressure extending from feature. the Greenland-Norwegian seas into the Eurasian and Makarov basins The 2005-2008 high-AO-index shift exemplifies a change in Arctic (Supplementary Fig.2).When the winter AO index increased in 2007, Ocean characteristics that began in 1989 and largely characterized the the SLP anomaly decreased over the Eurasian and Makarov basins, next 20 years(Supplementary Information 2).Then,as in 2005-2008, reflecting the AO pattern(Fig.3a).The trough in SLP anomaly forces the AO index increased relative to its pre-1989 average,and the trans- a trough in DOT aligned with the Russian shelf-break(Fig.3b and polar drift of sea ice and surface water shifted cyclonically(Sup- Fig.2a).The trough pattern includes upwelling of isohaline surfaces plementary Fig.13a-f).Salinity increased in the Makarov and under the centre of the trough,as indicated by increased SPA (Fig.3c, Eurasian basins026 and decreased in the Beaufort Sea(Supplemen- Fig.2b).It also includes increased DOT and downwelling of isohalines tary Fig.4a)owing to an increase in the fraction of runoff,specifically across the Russian shelf.Raised DOT towards the coast moves fresher caused by a diversion of Eurasian runoff to the east2.An important runoff-rich water eastward.The average upper-ocean circulation difference is that,although the 2005-2008 Canada basin circula- patterns for 2004-2005(Supplementary Fig.13e)and 2007-2009(Sup- tion was increasingly anticyclonic,it became less anticyclonic and plementary Fig.13f)confirm in absolute terms the increased cyclonic doming decreased in the early 1990s2(Supplementary Figs 13a-f). circulation on the Russian side of the Arctic Ocean(Figs 2a and 3b). Clearly,increased doming was not the cause of the 1990s Beaufort Our observations suggest idealized modes of Arctic Ocean circula- Sea freshening. tion(Fig.4).In the low-AO-index mode(Fig.4a),an expanded high in The climate implications of cyclonic AO-induced shifts in fresh- SLP drives an anticyclonic surface circulation over most of the basin. water pathways include increasing deep thermohaline convection in 2006.A0=-02 2007,A0=1.3 2008.A0=0.8 10 Lena R 6 42024680 4080008640000000006 _50 Figure 32006-2008 anomalies relative to 2004-2005 averages of SLP, contribution.b,DOT (February-March)(in cm).c,SPA,equal to the DOTand SPA.a,Winter sealevel atmospheric pressure from the International February-March-average OBP minus DOT.The SLP is the winter (previous Arctic Buoy Program (http://iabp.aplwashington.edu/data_slp.html).Black November-April)average.The text AO value is the winter (November-April) contours are the mean SLP anomaly relative to 2004-2005 plus the AO average anomaly relative to the 1950-1989 average winter AO. 68 INATURE I VOL 481I5 JANUARY 2012 2012 Macmillan Publishers Limited.All rights reservedrate of change of deep-basin freshwater volume and its difference from the larger area average are comparable to recent rates of change in ice volume24 and variations in liquid freshwater exports25 (Supplementary Information 7), illustrating the importance of observations with sufficiently broad spatial coverage (Supplementary Information 9). Maps of 2006–2008 sea level pressure (SLP), DOT and SPA anomalies (Fig. 3) are consistent with variations in the AO. Just as highs in SLP force convergence of near-surface Ekman transport, doming of DOT and deepening of isohaline surfaces, SLP lows cause divergence, development of a trough in DOT and shoaling of isohalines. Whereas the Beaufort High dominates the mean SLP pattern, the AO manifests itself over the Arctic Ocean as a trough of low pressure extending from the Greenland–Norwegian seas into the Eurasian and Makarov basins (Supplementary Fig. 2). When the winter AO index increased in 2007, the SLP anomaly decreased over the Eurasian and Makarov basins, reflecting the AO pattern (Fig. 3a). The trough in SLP anomaly forces a trough in DOT aligned with the Russian shelf-break (Fig. 3b and Fig. 2a). The trough pattern includes upwelling of isohaline surfaces under the centre of the trough, as indicated by increased SPA (Fig. 3c, Fig. 2b). It also includes increased DOT and downwelling of isohalines across the Russian shelf. Raised DOT towards the coast moves fresher runoff-rich water eastward. The average upper-ocean circulation patterns for 2004–2005 (Supplementary Fig. 13e) and 2007–2009 (Supplementary Fig. 13f) confirm in absolute terms the increased cyclonic circulation on the Russian side of the Arctic Ocean (Figs 2a and 3b). Our observations suggest idealized modes of Arctic Ocean circulation (Fig. 4). In the low-AO-index mode (Fig. 4a), an expanded high in SLP drives an anticyclonic surface circulation over most of the basin. The SLP pattern is similar to the mean SLP pattern (Supplementary Fig. 2a) but strengthened and expanded westward. Eurasian runoff leaves the Arctic directly across the Eurasian basin. In the high-AOindex pattern (Fig. 4b), cyclonic motion occurs on the Russian side of the Arctic Ocean, and the anticyclonic cell shifts to the southeast in the Canada basin. Eurasian runoff is diverted eastward and off the East Siberian shelf into the Canada basin circulation, where it can increase freshwater content through Ekman transport at the surface and by geostrophic currents at depth. The dipole character of the cyclonic mode and its connection to the AO cannot be captured by the doming index6 because the doming criterion considers only a single DOT feature. The 2005–2008 high-AO-index shift exemplifies a change in Arctic Ocean characteristics that began in 1989 and largely characterized the next 20 years (Supplementary Information 2). Then, as in 2005–2008, the AO index increased relative to its pre-1989 average, and the transpolar drift of sea ice and surface water shifted cyclonically10 (Supplementary Fig. 13a–f). Salinity increased in the Makarov and Eurasian basins10,26,27 and decreased in the Beaufort Sea1,2 (Supplementary Fig. 4a) owing to an increase in the fraction of runoff7 , specifically caused by a diversion of Eurasian runoff to the east26,27. An important difference is that, although the 2005–2008 Canada basin circulation was increasingly anticyclonic, it became less anticyclonic and doming decreased in the early 1990s2 (Supplementary Figs 13a–f). Clearly, increased doming was not the cause of the 1990s Beaufort Sea freshening. The climate implications of cyclonic AO-induced shifts in freshwater pathways include increasing deep thermohaline convection in −8 −6 −4 −2 0 2 4 6 8 10 –10 −2.5 −2 −2 −2 −2 −1.5 −1.5 −1.5 −1.5 −1 −1 −1 −1 −1 −0.5 −0.5 −0.5 0 0 0.5 − −4 −4 −4 −4 −3 −4 −3 −3 −3 − −2 −2 −2 −2 −2 −1 −1 −1 0 0 1 −0.4 −0.2 0 0.2 0.2 0.4 0.4 0.4 0.4 . 0 6 0.6 0.6 0.6 0.6 0.8 0.8 0.8 0.8 0.8 1 1 1 1 1.2 1.2 1.2 1.2 1.2 1.4 1.4 1.4 1.4 1.4 1.6 AO = –0.2 −40 −30 −20 –10 0 10 20 30 40 −50 −40 −30 −20 −10 0 10 20 30 40 −50 Russia Alaska Canada Greenland 2006, 2007, AO = 1.3 2008, AO = 0.8 SLP (hPa) DOT (cm) SPA (cm of water equivalent) Lomonosov R Canada basin Eurasian basin 90° W 0° 70° N 80° N Lena R Ob R 180° Yenisey R Alpha-Mendeleyev ridge Makarov basin a b c Figure 3 | 2006–2008 anomalies relative to 2004–2005 averages of SLP, DOT and SPA. a,Winter sea level atmospheric pressure from the International Arctic Buoy Program (http://iabp.apl.washington.edu/data_slp.html). Black contours are the mean SLP anomaly relative to 2004–2005 plus the AO contribution. b, DOT (February–March) (in cm). c, SPA, equal to the February–March-average OBP minus DOT. The SLP is the winter (previous November–April) average. The text AO value is the winter (November–April) average anomaly relative to the 1950–1989 average winter AO. RESEARCH LETTER 68 | NATURE | VOL 481 | 5 JANUARY 2012 ©2012 Macmillan Publishers Limited. All rights reserved