正在加载图片...
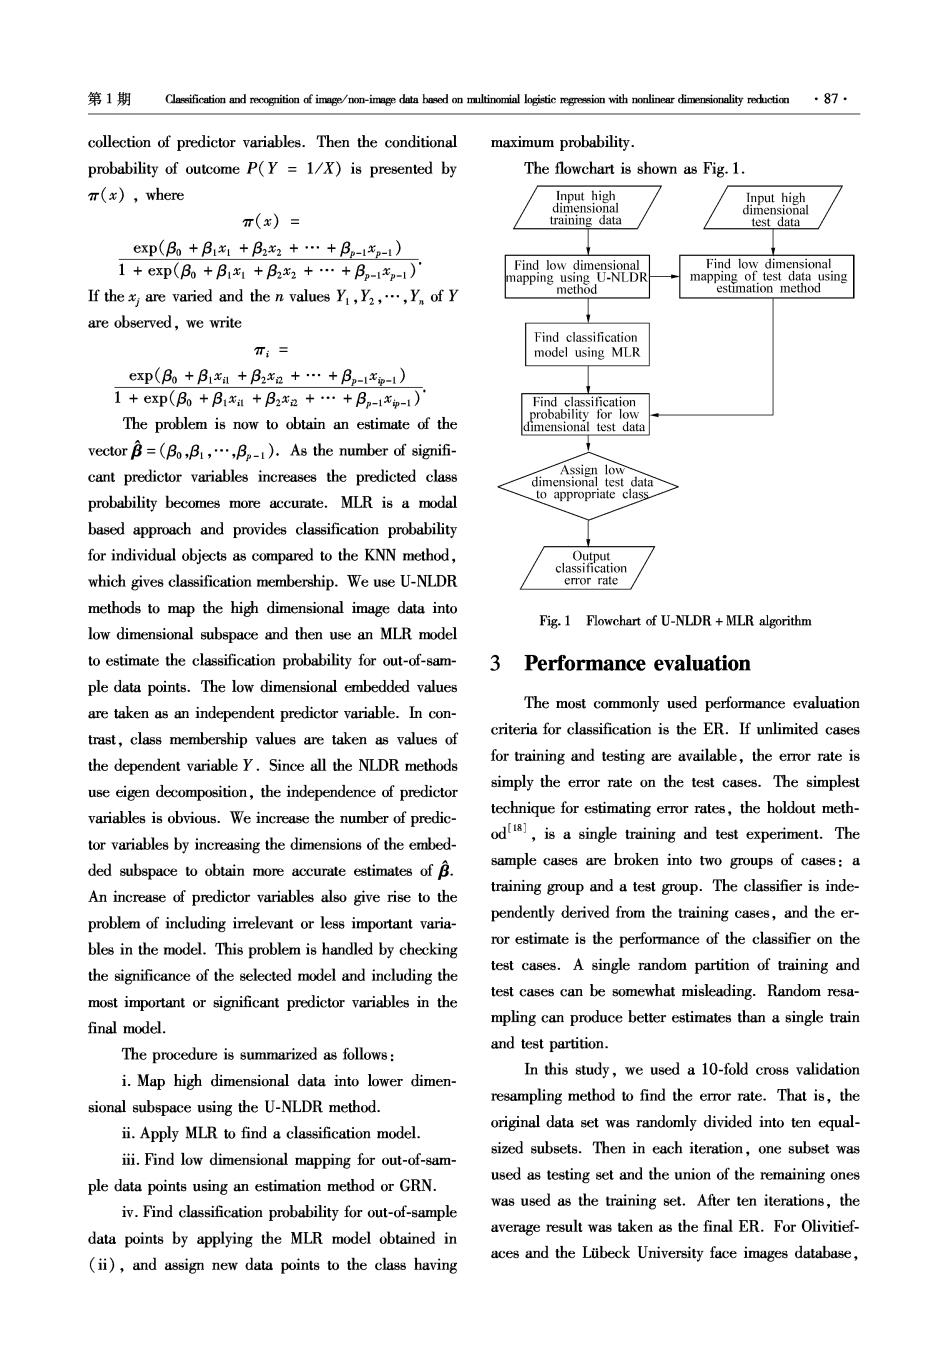
第1期 Classification and recognition of image/non-image data based on multinomial logistic regression with nonlinear dimensionality reduction87 collection of predictor variables.Then the conditional maximum probability. probability of outcome P(Y =1/X)is presented by The flowchart is shown as Fig.1. ()where Input high dimensional imensional π(x)= training data test data exp(B+B1+B2x2+…+B2-l2-1) 1+exp(B+B1出+B,2+…+B-1x-1) Find low dimensional Find low dimensional mapping of test data using If the x are varied and the n values Y,Y2,,Y of Y estimation method are observed,we write Find classification T:= model using MLR exp(B0+B11+B2x2+·+Bp-1p-1) 1+exp(B0+B1xH+B2x2+…+B2-1xp-1) Find classification The problem is now to obtain an estimate of the probability for low dimensional test data vector B=(Bo,B,B1).As the number of signifi- cant predictor variables increases the predicted class Assign low dimensional test data probability becomes more accurate.MLR is a modal to appropriate class based approach and provides classification probability for individual objects as compared to the KNN method, Output classification which gives classification membership.We use U-NLDR error rate methods to map the high dimensional image data into Fig.1 Flowchart of U-NLDR MLR algorithm low dimensional subspace and then use an MLR model to estimate the classification probability for out-of-sam- 3 Performance evaluation ple data points.The low dimensional embedded values are taken as an independent predictor variable.In con- The most commonly used performance evaluation criteria for classification is the ER.If unlimited cases trast,class membership values are taken as values of the dependent variable Y.Since all the NLDR methods for training and testing are available,the error rate is use eigen decomposition,the independence of predictor simply the error rate on the test cases.The simplest variables is obvious.We increase the number of predic- technique for estimating error rates,the holdout meth- tor variables by increasing the dimensions of the embed- ods,is a single training and test experiment.The ded subspace to obtain more accurate estimates of B. sample cases are broken into two groups of cases:a An increase of predictor variables also give rise to the training group and a test group.The classifier is inde- problem of including irrelevant or less important varia- pendently derived from the training cases,and the er- bles in the model.This problem is handled by checking ror estimate is the performance of the classifier on the test cases.A single random partition of training and the significance of the selected model and including the most important or significant predictor variables in the test cases can be somewhat misleading.Random resa- final model. mpling can produce better estimates than a single train and test partition. The procedure is summarized as follows: i.Map high dimensional data into lower dimen- In this study,we used a 10-fold cross validation sional subspace using the U-NLDR method. resampling method to find the error rate.That is,the ii.Apply MLR to find a classification model. original data set was randomly divided into ten equal- iii.Find low dimensional mapping for out-of-sam- sized subsets.Then in each iteration,one subset was ple data points using an estimation method or GRN. used as testing set and the union of the remaining ones was used as the training set.After ten iterations,the iv.Find classification probability for out-of-sample data points by applying the MLR model obtained in average result was taken as the final ER.For Olivitief- (ii),and assign new data points to the class having aces and the Lubeck University face images database