正在加载图片...

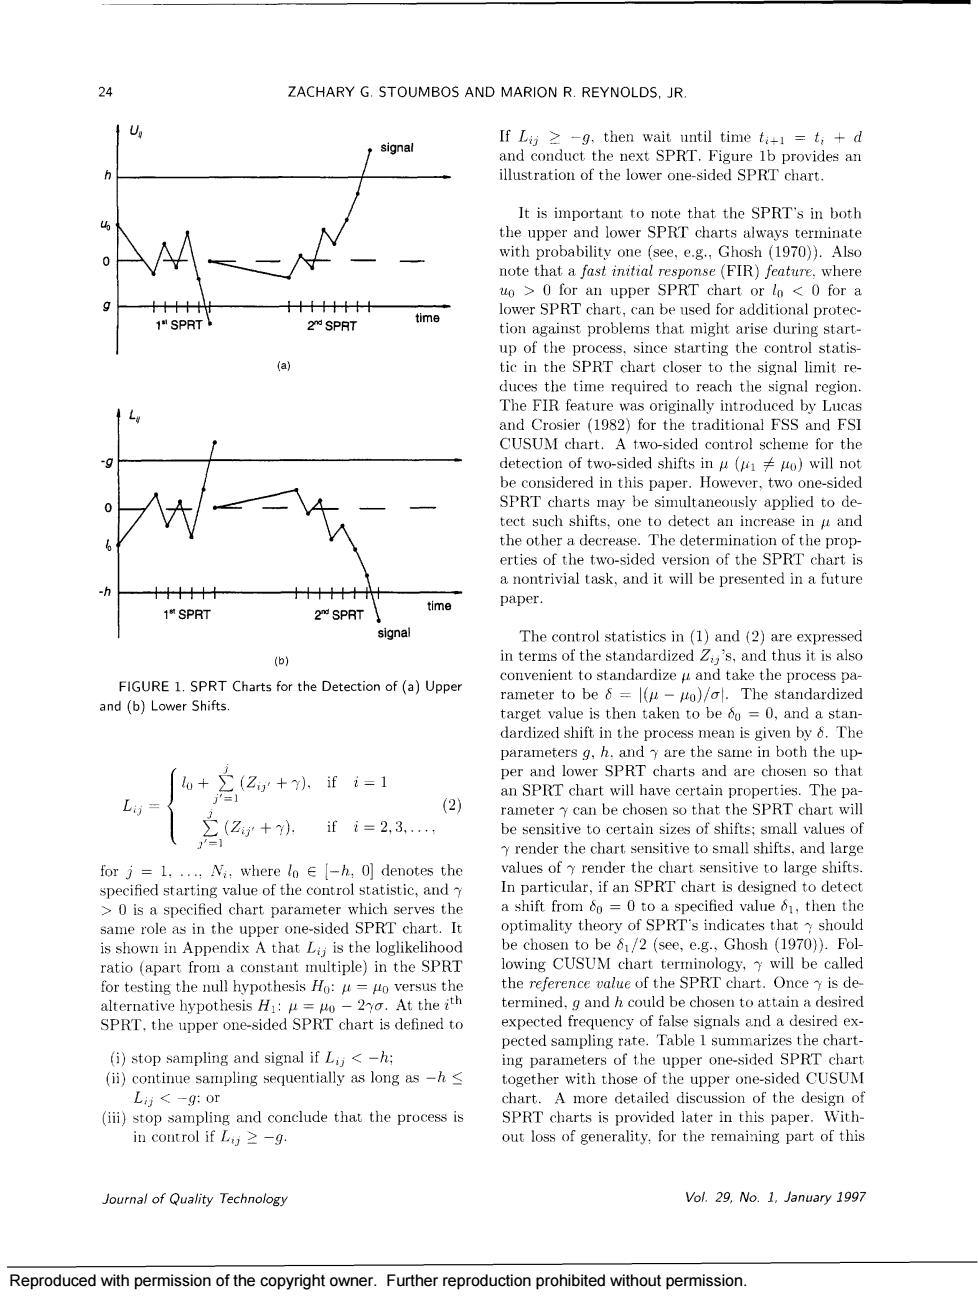
24 ZACHARY G.STOUMBOS AND MARION R.REYNOLDS,JR. If Lg z-9.then wait until timet=t;+d signal It is important to note that the SPRT's in both the upper SPRT char uo>0 for an upper SPRT chart or lo <0 for a time up of the process.since starting the control statis tie in the SPRT chart closer to the signal limitre by Luc and Crosier(1982)for the traditional FSS and FS OM chart. r th be considered in this paper.However two one-sided SPRT charts may be simultaneously applied to de erties of the two-sided version of the SPRT chart is a nontrivial task,and it will be presented in a future 1"SPRT time paper 2 SPRT The control statistics in (1)and (2)are expressed tb) rameter to be&=μ- o)l.The standardized (2 The pa ,(2+ii=2.3. y render the chart sensitive to small shifts.and large N,where lo [h,0]denotes the alues of sen a shift from 6o =0 to a ecified value 6 then the optimality theory of SPRT's indic tha is shown in Appendix A that L is the loglikelil e ch CUSUM chart (see,e.g 1 iple)n the S the reference value of the SPRT chart.Once is de alternative bypotbesis= 20.At the ith be chosen to attaina desire SPRT.the upper one-sided SPRT chart is defined to (i)stop sampling and signal ifh ther witn upper one SPRT charts is provided later in this paper.With in coutrol ifa >-g. out loss of generality.for the remaining part of this ournal of Quality Technolog Vol.29.No.1.January 1997 Reproduced with permission of the copyright owner.Further reproduction prohibited without permission. Reproduced with permission of the copyright owner. Further reproduction prohibited without permission