正在加载图片...

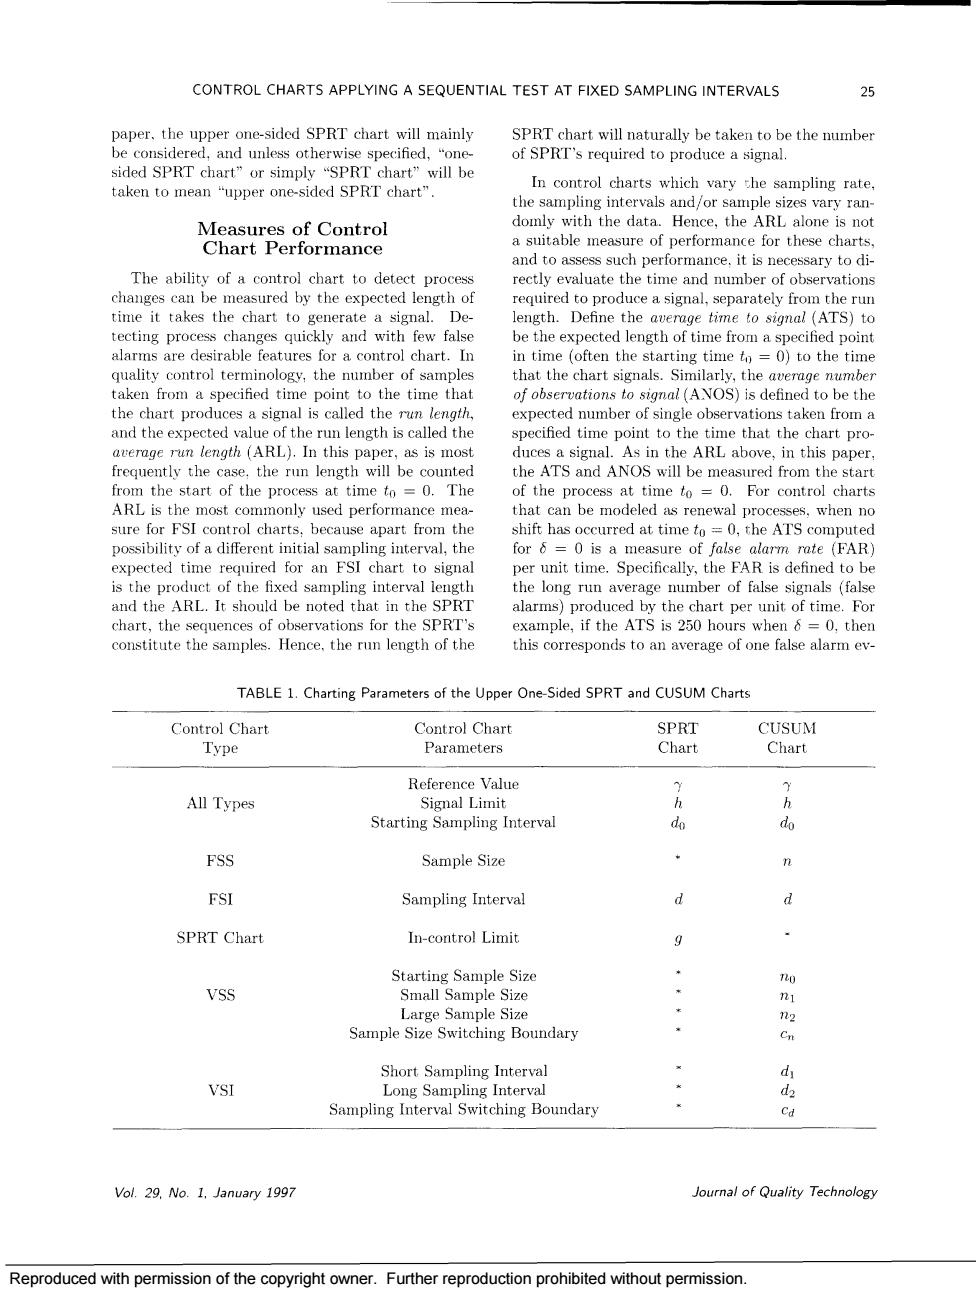
CONTROL CHARTS APPLYING A SEQUENTIAL TEST AT FIXED SAMPLING INTERVALS SPRT chart will naturally be taken to be the number of SPRT's required to produce a signal. domly with the data.Hence,the ARL alone is not a sitable measure of performance for these chart The ability of a control chart to detect process rectly evaluate the time and number of observations measured by the expected length of d en to sign alarms are desirable features for a control chart.In o=0)to the tim hat the chart arly.th verage num cted number of single observa and the expected value of the run length is called the specified time point to the time that the chart pro 1 n this paper ARL above,i this pape from the start of the process at time.The f the process at time to=o For control charts hat t init apa expected time required for an FSI chart to signal unit time.Specifically,the FAR is defined to be rt,for the SPRI =0 ther constitute the samples.Hence.the run length of the this corresponds to an average of one false alarm ev TABLE 1.Cha ng para eter s of the Upper One-Sided SPRT and CUSUM Charts m CUSUM Chart Reference value All Types Signal Limit Starting Sampling Interval do do FSS Sample Size FSI Sampling Interval SPRT Chart In-control Limit VSS .: Short Sampling Interval d VSI Vol.29.No.1.January 1997 Journal of Quality Technology Reproduced with permission of the copyright owner.Further reproduction prohibited without permission.Reproduced with permission of the copyright owner. Further reproduction prohibited without permission