正在加载图片...
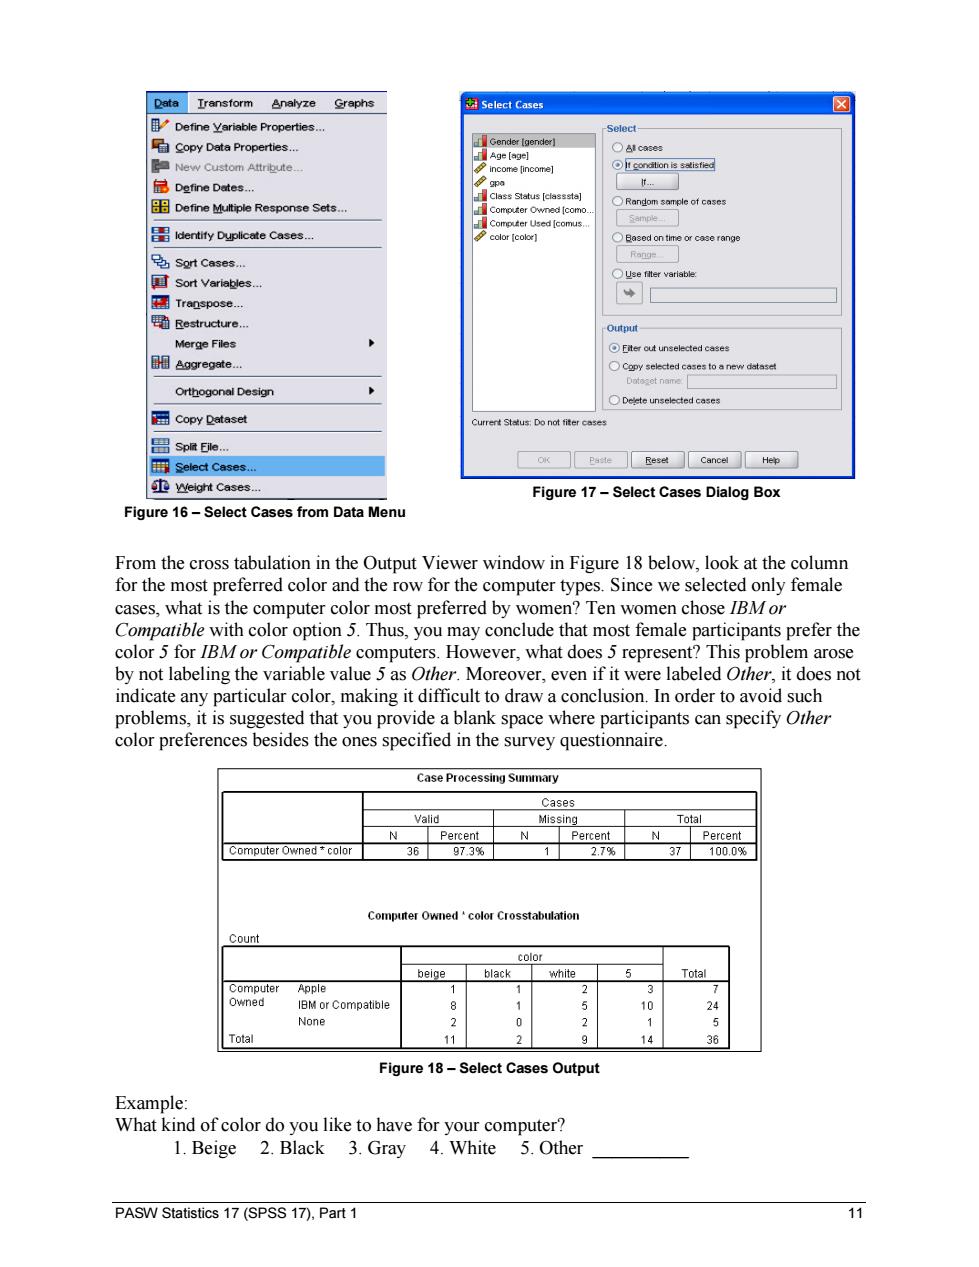
Data Iransform Analyze Graphs 图Select Cases ☒ Define Yariable Properties... -Select- Copy Data Properties... Gender [gender】 Age [age] Al cases New Custom Attri电ute- income [income] It gondtion is satisfied Define Dotes.… Class Status [classsta] Define Multiple Response Sets.... ORandom sample of cases Computer Owned [como. Computer Used [comus. Sample ldentify Duplicate Cases. color [color] OBased on time or case range Sort Cases.… Range 国Sort Variables.… ○Use flter variable: Transpose... 0 Restructure.… Output- Merge Files Eiter out unselected cases 日&ggregete.… Copy selected cases to a new dataset Dotozet name Orthogonal Design ODelete unselected cases Copy Dataset Current Status:Do not fiter cases ☐Splt Eile. Select Cases.. OK Paste Reset Cancel Help Weight Cases. Figure 17-Select Cases Dialog Box Figure 16-Select Cases from Data Menu From the cross tabulation in the Output Viewer window in Figure 18 below,look at the column for the most preferred color and the row for the computer types.Since we selected only female cases,what is the computer color most preferred by women?Ten women chose /BMor Compatible with color option 5.Thus,you may conclude that most female participants prefer the color 5 for IBM or Compatible computers.However,what does 5 represent?This problem arose by not labeling the variable value 5 as Other.Moreover,even if it were labeled Other,it does not indicate any particular color,making it difficult to draw a conclusion.In order to avoid such problems,it is suggested that you provide a blank space where participants can specify Other color preferences besides the ones specified in the survey questionnaire Case Processing Summary Cases Valid Missing Total N Percent N Percent N Percent Computer Owned color 36 97.3% 1 2.7% 37 100.0% Computer Owned color Crosstabulation Count color beige black white 5 Total Computer Apple 2 3 owned l旧M or Compatible 5 None 2 0 2 1 5 Total 11 9 14 36 Figure 18-Select Cases Output Example: What kind of color do you like to have for your computer? 1.Beige 2.Black 3.Gray 4.White 5.Other PASW Statistics 17(SPSS 17),Part 1 11PASW Statistics 17 (SPSS 17), Part 1 11 Figure 16 – Select Cases from Data Menu Figure 17 – Select Cases Dialog Box From the cross tabulation in the Output Viewer window in Figure 18 below, look at the column for the most preferred color and the row for the computer types. Since we selected only female cases, what is the computer color most preferred by women? Ten women chose IBM or Compatible with color option 5. Thus, you may conclude that most female participants prefer the color 5 for IBM or Compatible computers. However, what does 5 represent? This problem arose by not labeling the variable value 5 as Other. Moreover, even if it were labeled Other, it does not indicate any particular color, making it difficult to draw a conclusion. In order to avoid such problems, it is suggested that you provide a blank space where participants can specify Other color preferences besides the ones specified in the survey questionnaire. Figure 18 – Select Cases Output Example: What kind of color do you like to have for your computer? 1. Beige 2. Black 3. Gray 4. White 5. Other __________