正在加载图片...
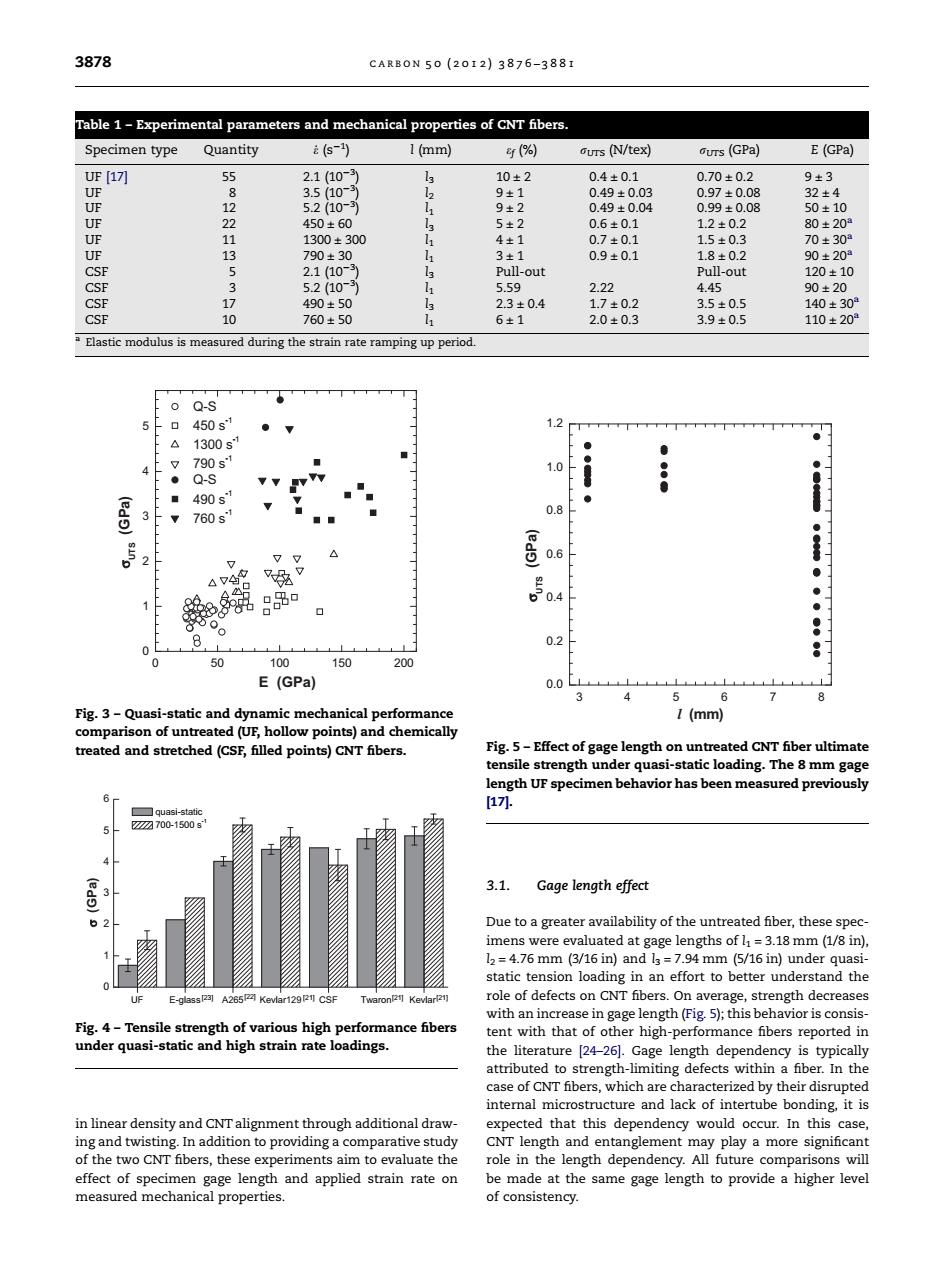
3878 CARB0N50(2012)3876-388I Table 1-Experimental parameters and mechanical properties of CNT fibers. Specimen type Quantity (s-) 1(mm) 可(%) aurs (N/tex) aurs(GPa) E(GPa) UF[17] 2.1(10-3 10±2 0.4±0.1 0.70±0.2 9±3 UF 8 3.5(10-) 9±1 0.49±0.03 0.97±0.08 32±4 UF 12 5.2(10-) 9±2 0.49±0.04 0.99±0.08 50±10 UF 22 450±60 3 5±2 0.6±0.1 1.2±0.2 80±20 UF 11 1300±300 4±1 0.7±0.1 1.5±0.3 70±30 UF 13 790±30 3±1 0.9±0.1 1.8±0.2 90±203 CSF 2.1(10- Pull-out Pull-out 120±10 CSF 3 5.2(10- 5.59 2.22 4.45 90±20 CSF 17 490±50 2.3±0.4 1.7±0.2 3.5±0.5 140±30 CSF 10 760±50 6±1 2.0±0.3 3.9±0.5 110±203 Elastic modulus is measured during the strain rate ramping up period Q-S 5 450s1 1300s1 ● ◆ 色 790s1 1.0 ● Q-S ◆ 490s1 3 760s1 0.8 △ 且 ● 4 g80 00 8 0.2 8 0 50 100 150 200 E(GPa) 0.0 3 5 6 7 8 Fig.3-Quasi-static and dynamic mechanical performance 1 (mm) comparison of untreated(UF,hollow points)and chemically treated and stretched(CSF,filled points)CNT fibers. Fig.5-Effect of gage length on untreated CNT fiber ultimate tensile strength under quasi-static loading.The 8 mm gage length UF specimen behavior has been measured previously 17八. ☐quasi-static Z7☑700-1500s (eds) 3.1. Gage length effect Due to a greater availability of the untreated fiber,these spec- imens were evaluated at gage lengths of =3.18 mm(1/8 in). 12=4.76 mm (3/16 in)and I3=7.94 mm (5/16 in)under quasi- static tension loading in an effort to better understand the UF E-glass231 A265124 Kevlar1291211 CSF Twaron Kevlar2 role of defects on CNT fibers.On average,strength decreases with an increase in gage length(Fig.5);this behavior is consis- Fig.4-Tensile strength of various high performance fibers tent with that of other high-performance fibers reported in under quasi-static and high strain rate loadings. the literature [24-26].Gage length dependency is typically attributed to strength-limiting defects within a fiber.In the case of CNT fibers,which are characterized by their disrupted internal microstructure and lack of intertube bonding,it is in linear density and CNT alignment through additional draw- expected that this dependency would occur.In this case, ing and twisting.In addition to providing a comparative study CNT length and entanglement may play a more signifcant of the two CNT fibers,these experiments aim to evaluate the role in the length dependency.All future comparisons will effect of specimen gage length and applied strain rate on be made at the same gage length to provide a higher level measured mechanical properties. of consistency.in linear density and CNT alignment through additional drawing and twisting. In addition to providing a comparative study of the two CNT fibers, these experiments aim to evaluate the effect of specimen gage length and applied strain rate on measured mechanical properties. 3.1. Gage length effect Due to a greater availability of the untreated fiber, these specimens were evaluated at gage lengths of l1 = 3.18 mm (1/8 in), l2 = 4.76 mm (3/16 in) and l3 = 7.94 mm (5/16 in) under quasistatic tension loading in an effort to better understand the role of defects on CNT fibers. On average, strength decreases with an increase in gage length (Fig. 5); this behavior is consistent with that of other high-performance fibers reported in the literature [24–26]. Gage length dependency is typically attributed to strength-limiting defects within a fiber. In the case of CNT fibers, which are characterized by their disrupted internal microstructure and lack of intertube bonding, it is expected that this dependency would occur. In this case, CNT length and entanglement may play a more significant role in the length dependency. All future comparisons will be made at the same gage length to provide a higher level of consistency. 345678 0.0 0.2 0.4 0.6 0.8 1.0 1.2 σUTS (GPa) l (mm) Fig. 5 – Effect of gage length on untreated CNT fiber ultimate tensile strength under quasi-static loading. The 8 mm gage length UF specimen behavior has been measured previously [17]. Table 1 – Experimental parameters and mechanical properties of CNT fibers. Specimen type Quantity e_ (s1 ) l (mm) ef (%) rUTS (N/tex) rUTS (GPa) E (GPa) UF [17] 55 2.1 (103 ) l3 10 ± 2 0.4 ± 0.1 0.70 ± 0.2 9 ± 3 UF 8 3.5 (103 ) l2 9 ± 1 0.49 ± 0.03 0.97 ± 0.08 32 ± 4 UF 12 5.2 (103 ) l1 9 ± 2 0.49 ± 0.04 0.99 ± 0.08 50 ± 10 UF 22 450 ± 60 l3 5 ± 2 0.6 ± 0.1 1.2 ± 0.2 80 ± 20a UF 11 1300 ± 300 l1 4 ± 1 0.7 ± 0.1 1.5 ± 0.3 70 ± 30a UF 13 790 ± 30 l1 3 ± 1 0.9 ± 0.1 1.8 ± 0.2 90 ± 20a CSF 5 2.1 (103 ) l3 Pull-out Pull-out 120 ± 10 CSF 3 5.2 (103 ) l1 5.59 2.22 4.45 90 ± 20 CSF 17 490 ± 50 l3 2.3 ± 0.4 1.7 ± 0.2 3.5 ± 0.5 140 ± 30a CSF 10 760 ± 50 l1 6 ± 1 2.0 ± 0.3 3.9 ± 0.5 110 ± 20a a Elastic modulus is measured during the strain rate ramping up period. 0 50 100 150 200 0 1 2 3 4 5 Q-S 450 s-1 1300 s-1 790 s-1 Q-S 490 s-1 760 s-1 σUTS (GPa) E (GPa) Fig. 3 – Quasi-static and dynamic mechanical performance comparison of untreated (UF, hollow points) and chemically treated and stretched (CSF, filled points) CNT fibers. UF E-glass A265 Kevlar129 CSF Twaron Kevlar 0 1 2 3 4 5 6 σ (GPa) quasi-static 700-1500 s-1 [23] [22] [ [21] 21] [21] Fig. 4 – Tensile strength of various high performance fibers under quasi-static and high strain rate loadings. 3878 CARBON 50 (2012) 3876 – 3881������