正在加载图片...
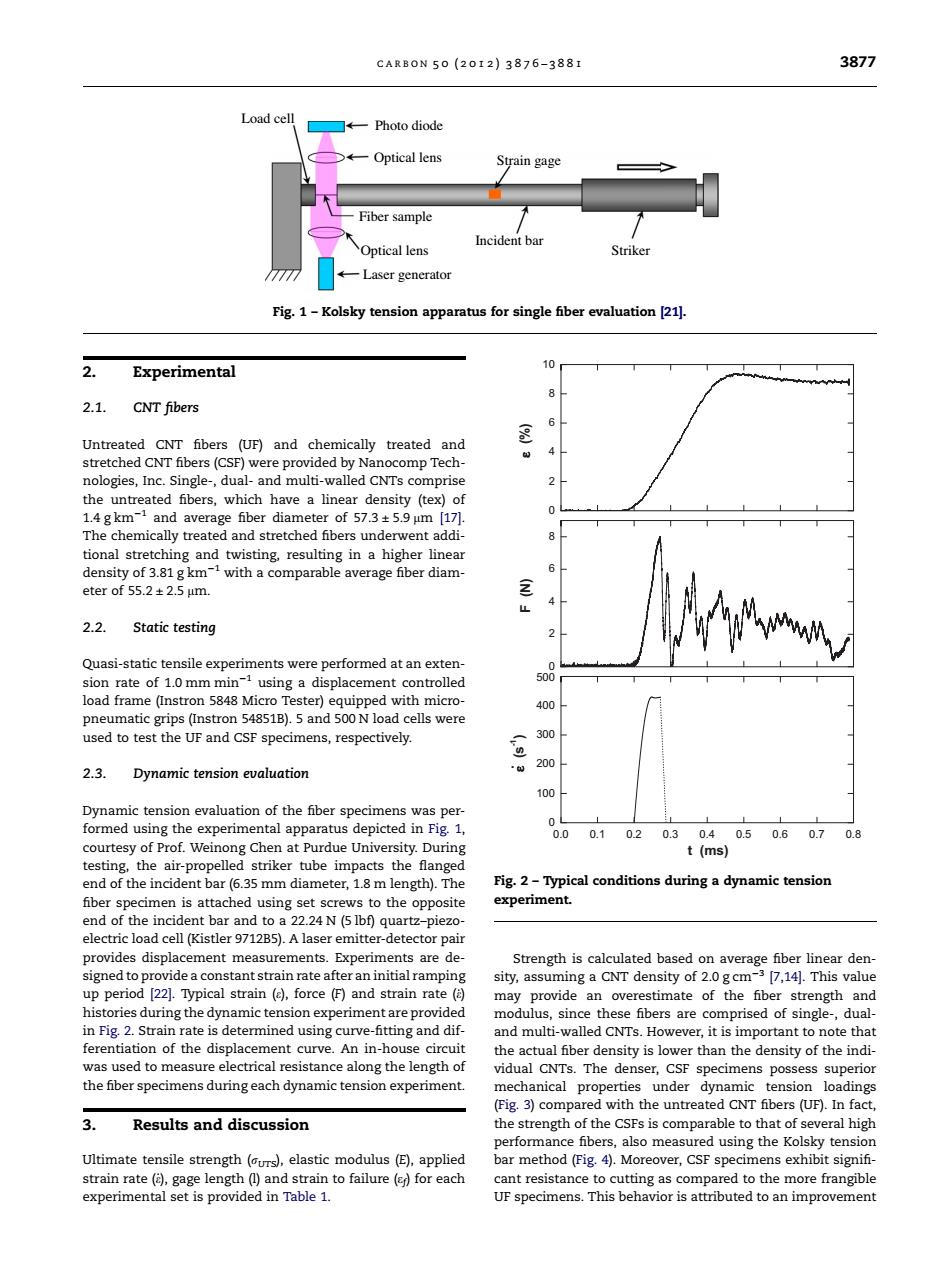
CARB0N50(2012)3876-388I 3877 Load cell Photo diode Optical lens Strain gage Fiber sample Optical lens Incident bar Striker Laser generator Fig.1-Kolsky tension apparatus for single fiber evaluation [21]. 10 Experimental 2.1. CNT fibers Untreated CNT fibers (UF)and chemically treated and 8 stretched CNT fibers(CSF)were provided by Nanocomp Tech- nologies,Inc.Single-,dual-and multi-walled CNTs comprise the untreated fibers,which have a linear density (tex)of 1.4 gkm and average fiber diameter of 57.3+5.9 um [17]. The chemically treated and stretched fibers underwent addi- tional stretching and twisting,resulting in a higher linear density of 3.81g km-1 with a comparable average fiber diam- eter of55.2±2.5um. 三 2.2. Static testing Quasi-static tensile experiments were performed at an exten- sion rate of 1.0 mm min-1 using a displacement controlled 500 load frame (Instron 5848 Micro Tester)equipped with micro- 400 pneumatic grips(Instron 54851B).5 and 500 N load cells were used to test the UF and CSF specimens,respectively. 300 边 200 2.3. Dynamic tension evaluation 100 Dynamic tension evaluation of the fiber specimens was per- formed using the experimental apparatus depicted in Fig.1, 0.0 0.1 02 0.30.40.50.60.70.8 courtesy of Prof.Weinong Chen at Purdue University.During t (ms) testing,the air-propelled striker tube impacts the flanged end of the incident bar(6.35 mm diameter,1.8 m length).The Fig.2-Typical conditions during a dynamic tension fiber specimen is attached using set screws to the opposite experiment. end of the incident bar and to a 22.24 N(5 lbf)quartz-piezo- electric load cell(Kistler 9712B5).A laser emitter-detector pair provides displacement measurements.Experiments are de- Strength is calculated based on average fiber linear den- signed to provide a constant strain rate after an initial ramping sity,assuming a CNT density of 2.0 gcm-3[7,14].This value up period [22.Typical strain (e),force (F)and strain rate ( may provide an overestimate of the fiber strength and histories during the dynamic tension experiment are provided modulus,since these fibers are comprised of single-,dual- in Fig.2.Strain rate is determined using curve-fitting and dif- and multi-walled CNTs.However,it is important to note that ferentiation of the displacement curve.An in-house circuit the actual fiber density is lower than the density of the indi- was used to measure electrical resistance along the length of vidual CNTs.The denser,CSF specimens possess superior the fiber specimens during each dynamic tension experiment. mechanical properties under dynamic tension loadings (Fig.3)compared with the untreated CNT fibers (UF).In fact, 3. Results and discussion the strength of the CSFs is comparable to that of several high performance fibers,also measured using the Kolsky tension Ultimate tensile strength(urs),elastic modulus(E),applied bar method(Fig.4).Moreover,CSF specimens exhibit signifi- strain rate ()gage length (1)and strain to failure (ep)for each cant resistance to cutting as compared to the more frangible experimental set is provided in Table 1. UF specimens.This behavior is attributed to an improvement2. Experimental 2.1. CNT fibers Untreated CNT fibers (UF) and chemically treated and stretched CNT fibers (CSF) were provided by Nanocomp Technologies, Inc. Single-, dual- and multi-walled CNTs comprise the untreated fibers, which have a linear density (tex) of 1.4 g km1 and average fiber diameter of 57.3 ± 5.9 lm [17]. The chemically treated and stretched fibers underwent additional stretching and twisting, resulting in a higher linear density of 3.81 g km1 with a comparable average fiber diameter of 55.2 ± 2.5 lm. 2.2. Static testing Quasi-static tensile experiments were performed at an extension rate of 1.0 mm min1 using a displacement controlled load frame (Instron 5848 Micro Tester) equipped with micropneumatic grips (Instron 54851B). 5 and 500 N load cells were used to test the UF and CSF specimens, respectively. 2.3. Dynamic tension evaluation Dynamic tension evaluation of the fiber specimens was performed using the experimental apparatus depicted in Fig. 1, courtesy of Prof. Weinong Chen at Purdue University. During testing, the air-propelled striker tube impacts the flanged end of the incident bar (6.35 mm diameter, 1.8 m length). The fiber specimen is attached using set screws to the opposite end of the incident bar and to a 22.24 N (5 lbf) quartz–piezoelectric load cell (Kistler 9712B5). A laser emitter-detector pair provides displacement measurements. Experiments are designed to provide a constant strain rate after an initial ramping up period [22]. Typical strain (e), force (F) and strain rate (e_) histories during the dynamic tension experiment are provided in Fig. 2. Strain rate is determined using curve-fitting and differentiation of the displacement curve. An in-house circuit was used to measure electrical resistance along the length of the fiber specimens during each dynamic tension experiment. 3. Results and discussion Ultimate tensile strength (rUTS), elastic modulus (E), applied strain rate (e_), gage length (l) and strain to failure (ef) for each experimental set is provided in Table 1. Strength is calculated based on average fiber linear density, assuming a CNT density of 2.0 g cm3 [7,14]. This value may provide an overestimate of the fiber strength and modulus, since these fibers are comprised of single-, dualand multi-walled CNTs. However, it is important to note that the actual fiber density is lower than the density of the individual CNTs. The denser, CSF specimens possess superior mechanical properties under dynamic tension loadings (Fig. 3) compared with the untreated CNT fibers (UF). In fact, the strength of the CSFs is comparable to that of several high performance fibers, also measured using the Kolsky tension bar method (Fig. 4). Moreover, CSF specimens exhibit signifi- cant resistance to cutting as compared to the more frangible UF specimens. This behavior is attributed to an improvement Strain gage Incident bar Striker Optical lens Optical lens Laser generator Photo diode Load cell Fiber sample Fig. 1 – Kolsky tension apparatus for single fiber evaluation [21]. 0 2 4 6 8 10 0 2 4 6 8 0.0 0.1 0.2 0.3 0.4 0.5 0.6 0.7 0.8 0 100 200 300 400 500 ε (%) F (N) ε (s-1 ) t (ms) . Fig. 2 – Typical conditions during a dynamic tension experiment. CARBON 50 (2012) 3876 – 3881 3877����