正在加载图片...
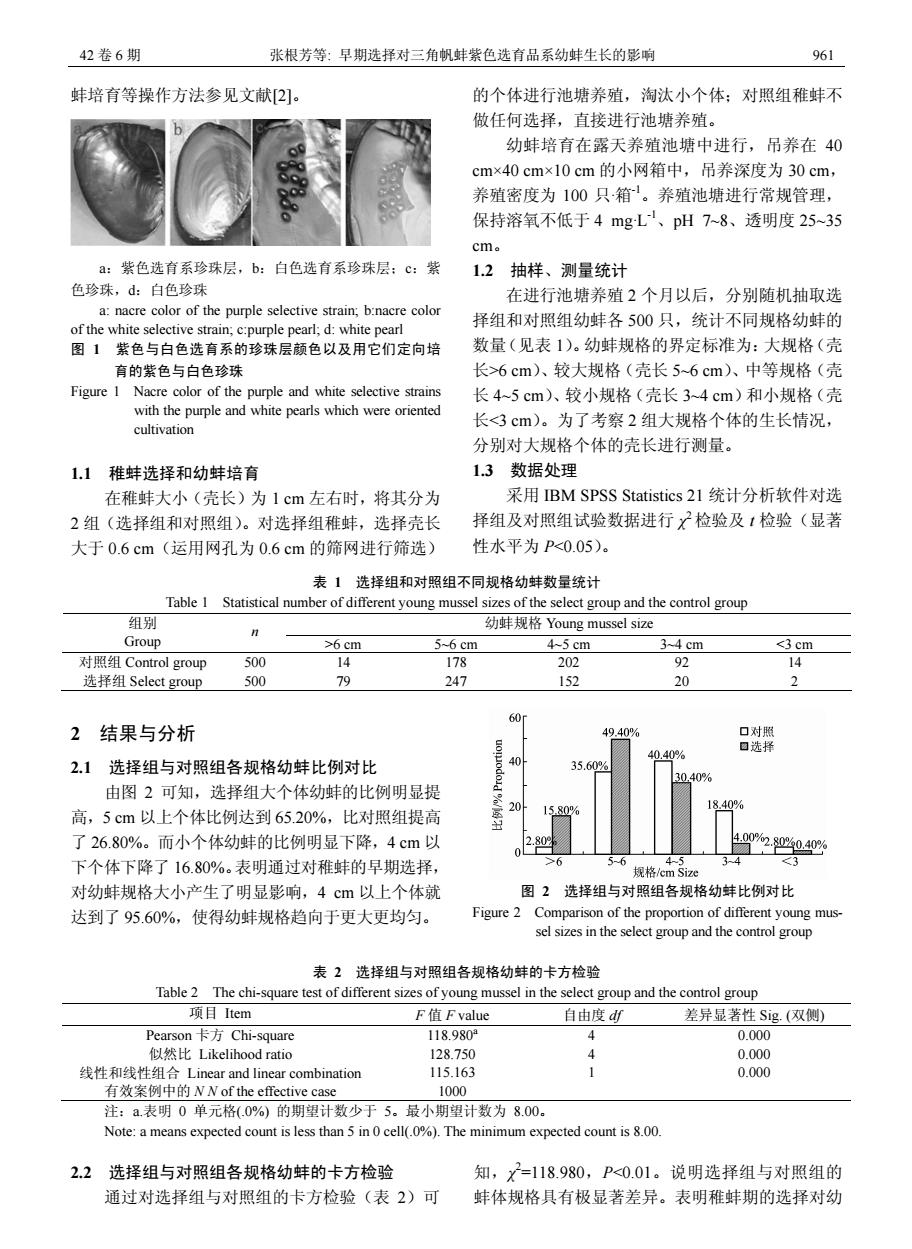
42卷6期 张根芳等:早期选择对三角帆蚌紫色选育品系幼蚌生长的影响 961 蚌培育等操作方法参见文献[2]。 的个体进行池塘养殖,淘汰小个体:对照组稚蚌不 做任何选择,直接进行池塘养殖。 幼蚌培育在露天养殖池塘中进行,吊养在40 cm×40cm×10cm的小网箱中,吊养深度为30cm, 养殖密度为100只箱。养殖池塘进行常规管理, 保持溶氧不低于4mgL、pH7~8、透明度25~35 cma a:紫色选育系珍珠层,b:白色选育系珍珠层:c:紫 1.2抽样、测量统计 色珍珠,d:白色珍珠 在进行池塘养殖2个月以后,分别随机抽取选 a:nacre color of the purple selective strain,b:nacre color 择组和对照组幼蚌各500只,统计不同规格幼蚌的 of the white selective strain;c:purple pearl;d:white pearl 图1紫色与白色选育系的珍珠层颜色以及用它们定向培 数量(见表1)。幼蚌规格的界定标准为:大规格(壳 育的紫色与白色珍珠 长>6cm)、较大规格(壳长5~6cm)中等规格(壳 Figure 1 Nacre color of the purple and white selective strains 长4~5cm)、较小规格(壳长3~4cm)和小规格(壳 with the purple and white pearls which were oriented 长<3cm)。为了考察2组大规格个体的生长情况, cultivation 分别对大规格个体的壳长进行测量。 1.1 稚蚌选择和幼蚌培育 13数据处理 在稚蚌大小(壳长)为1cm左右时,将其分为 采用IBM SPSS Statistics21统计分析软件对选 2组(选择组和对照组)。对选择组稚蚌,选择壳长 择组及对照组试验数据进行,检验及1检验(显著 大于0.6cm(运用网孔为0.6cm的筛网进行筛选) 性水平为P<0.05)。 表1选择组和对照组不同规格幼蚌数量统计 Table I Statistical number of different young mussel sizes of the select group and the control group 组别 幼蚌规格Young mussel size n Group >6cm 5-6cm 4-5cm 3~4cm <3 cm 对照组Control group 500 14 178 202 92 14 选择组Select group 500 79 247 152 20 2 60 2 结果与分析 49.40% 口对照 口选择 40.40% 2.1选择组与对照组各规格幼蚌比例对比 40 35.60% 30.40% 由图2可知,选择组大个体幼蚌的比例明显提 20 高,5cm以上个体比例达到65.20%,比对照组提高 1580% 18.40% 了26.80%。而小个体幼蚌的比例明显下降,4cm以 2.809 4.002.8040.40 下个体下降了16.80%。表明通过对稚蚌的早期选择, 4✉5 34 <3 规格/cm Size 对幼蚌规格大小产生了明显影响,4cm以上个体就 图2选择组与对照组各规格幼蚌比例对比 达到了95.60%,使得幼蚌规格趋向于更大更均匀。 Figure 2 Comparison of the proportion of different young mus. sel sizes in the select group and the control group 表2选择组与对照组各规格幼蚌的卡方检验 Table 2 The chi-square test of different sizes of young mussel in the select group and the control group 项目tem F值F value 自由度d 差异显著性Sg.(双侧) Pearson卡方Chi-square 118.980 4 0.000 似然比Likelihood ratio 128.750 0.000 线性和线性组合Linear and linear combination 115.163 0.000 有效案例中的NN of the effective case 1000 注:a表明0单元格(.0%)的期望计数少于5。最小期望计数为8.00。 Note:a means expected count is less than 5 in 0 cell(.0%).The minimum expected count is 8.00. 22选择组与对照组各规格幼蚌的卡方检验 知,X=118.980,P<0.01。说明选择组与对照组的 通过对选择组与对照组的卡方检验(表2)可 蚌体规格具有极显著差异。表明稚蚌期的选择对幼42 卷 6 期 张根芳等: 早期选择对三角帆蚌紫色选育品系幼蚌生长的影响 961 蚌培育等操作方法参见文献[2]。 a:紫色选育系珍珠层,b:白色选育系珍珠层;c:紫 色珍珠,d:白色珍珠 a: nacre color of the purple selective strain; b:nacre color of the white selective strain; c:purple pearl; d: white pearl 图 1 紫色与白色选育系的珍珠层颜色以及用它们定向培 育的紫色与白色珍珠 Figure 1 Nacre color of the purple and white selective strains with the purple and white pearls which were oriented cultivation 1.1 稚蚌选择和幼蚌培育 在稚蚌大小(壳长)为 1 cm 左右时,将其分为 2 组(选择组和对照组)。对选择组稚蚌,选择壳长 大于 0.6 cm(运用网孔为 0.6 cm 的筛网进行筛选) 的个体进行池塘养殖,淘汰小个体;对照组稚蚌不 做任何选择,直接进行池塘养殖。 幼蚌培育在露天养殖池塘中进行,吊养在 40 cm×40 cm×10 cm 的小网箱中,吊养深度为 30 cm, 养殖密度为 100 只·箱-1。养殖池塘进行常规管理, 保持溶氧不低于 4 mg·L-1、pH 7~8、透明度 25~35 cm。 1.2 抽样、测量统计 在进行池塘养殖 2 个月以后,分别随机抽取选 择组和对照组幼蚌各 500 只,统计不同规格幼蚌的 数量(见表 1)。幼蚌规格的界定标准为:大规格(壳 长>6 cm)、较大规格(壳长 5~6 cm)、中等规格(壳 长 4~5 cm)、较小规格(壳长 3~4 cm)和小规格(壳 长<3 cm)。为了考察 2 组大规格个体的生长情况, 分别对大规格个体的壳长进行测量。 1.3 数据处理 采用 IBM SPSS Statistics 21 统计分析软件对选 择组及对照组试验数据进行 χ 2 检验及 t 检验(显著 性水平为 P<0.05)。 表 1 选择组和对照组不同规格幼蚌数量统计 Table 1 Statistical number of different young mussel sizes of the select group and the control group 组别 幼蚌规格 Young mussel size Group n >6 cm 5~6 cm 4~5 cm 3~4 cm <3 cm 对照组 Control group 500 14 178 202 92 14 选择组 Select group 500 79 247 152 20 2 2 结果与分析 2.1 选择组与对照组各规格幼蚌比例对比 由图 2 可知,选择组大个体幼蚌的比例明显提 高,5 cm 以上个体比例达到 65.20%,比对照组提高 了 26.80%。而小个体幼蚌的比例明显下降,4 cm 以 下个体下降了 16.80%。表明通过对稚蚌的早期选择, 对幼蚌规格大小产生了明显影响,4 cm 以上个体就 达到了 95.60%,使得幼蚌规格趋向于更大更均匀。 图 2 选择组与对照组各规格幼蚌比例对比 Figure 2 Comparison of the proportion of different young mussel sizes in the select group and the control group 表 2 选择组与对照组各规格幼蚌的卡方检验 Table 2 The chi-square test of different sizes of young mussel in the select group and the control group 项目 Item F 值 F value 自由度 df 差异显著性 Sig. (双侧) Pearson 卡方 Chi-square 118.980a 4 0.000 似然比 Likelihood ratio 128.750 4 0.000 线性和线性组合 Linear and linear combination 115.163 1 0.000 有效案例中的 N N of the effective case 1000 注:a.表明 0 单元格(.0%) 的期望计数少于 5。最小期望计数为 8.00。 Note: a means expected count is less than 5 in 0 cell(.0%). The minimum expected count is 8.00. 2.2 选择组与对照组各规格幼蚌的卡方检验 通过对选择组与对照组的卡方检验(表 2)可 知,χ 2 =118.980,P<0.01。说明选择组与对照组的 蚌体规格具有极显著差异。表明稚蚌期的选择对幼