正在加载图片...
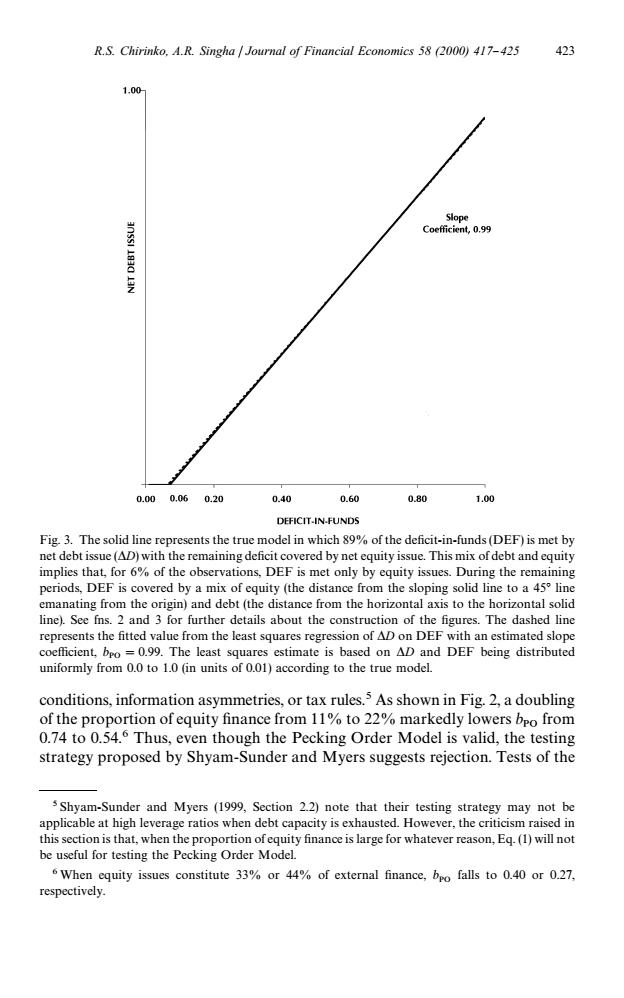
R.S.Chirinko.A.R.Singha Journal of Financial Economics 58 (2000)417-425 423 1.00 Slope Coefficient,0.99 0.000.060.20 0.40 0.60 0.80 1.00 DEFICIT-IN-FUNDS Fig.3.The solid line represents the true model in which 89%of the deficit-in-funds(DEF)is met by net debt issue(AD)with the remaining deficit covered by net equity issue.This mix of debt and equity implies that,for 6%of the observations,DEF is met only by equity issues.During the remaining periods,DEF is covered by a mix of equity (the distance from the sloping solid line to a 45 line emanating from the origin)and debt(the distance from the horizontal axis to the horizontal solid line).See fns.2 and 3 for further details about the construction of the figures.The dashed line represents the fitted value from the least squares regression of AD on DEF with an estimated slope coefficient,bpo =0.99.The least squares estimate is based on AD and DEF being distributed uniformly from 0.0 to 1.0 (in units of 0.01)according to the true model. conditions,information asymmetries,or tax rules.5 As shown in Fig.2,a doubling of the proportion ofequity finance from 11%to 22%markedly lowers bpo from 0.74 to 0.54.6 Thus,even though the Pecking Order Model is valid,the testing strategy proposed by Shyam-Sunder and Myers suggests rejection.Tests of the s Shyam-Sunder and Myers (1999,Section 2.2)note that their testing strategy may not be applicable at high leverage ratios when debt capacity is exhausted.However,the criticism raised in this section is that,when the proportion ofequity finance is large for whatever reason,Eq.(1)will not be useful for testing the Pecking Order Model. 6 When equity issues constitute 33%or 44%of external finance,bpo falls to 0.40 or 0.27, respectively.5 Shyam-Sunder and Myers (1999, Section 2.2) note that their testing strategy may not be applicable at high leverage ratios when debt capacity is exhausted. However, the criticism raised in this section is that, when the proportion of equity "nance is large for whatever reason, Eq. (1) will not be useful for testing the Pecking Order Model. 6When equity issues constitute 33% or 44% of external "nance, b PO falls to 0.40 or 0.27, respectively. Fig. 3. The solid line represents the true model in which 89% of the de"cit-in-funds (DEF) is met by net debt issue (*D) with the remaining de"cit covered by net equity issue. This mix of debt and equity implies that, for 6% of the observations, DEF is met only by equity issues. During the remaining periods, DEF is covered by a mix of equity (the distance from the sloping solid line to a 453 line emanating from the origin) and debt (the distance from the horizontal axis to the horizontal solid line). See fns. 2 and 3 for further details about the construction of the "gures. The dashed line represents the "tted value from the least squares regression of *D on DEF with an estimated slope coe$cient, b PO"0.99. The least squares estimate is based on *D and DEF being distributed uniformly from 0.0 to 1.0 (in units of 0.01) according to the true model. conditions, information asymmetries, or tax rules.5 As shown in Fig. 2, a doubling of the proportion of equity "nance from 11% to 22% markedly lowers b PO from 0.74 to 0.54.6 Thus, even though the Pecking Order Model is valid, the testing strategy proposed by Shyam-Sunder and Myers suggests rejection. Tests of the R.S. Chirinko, A.R. Singha / Journal of Financial Economics 58 (2000) 417}425 423