正在加载图片...
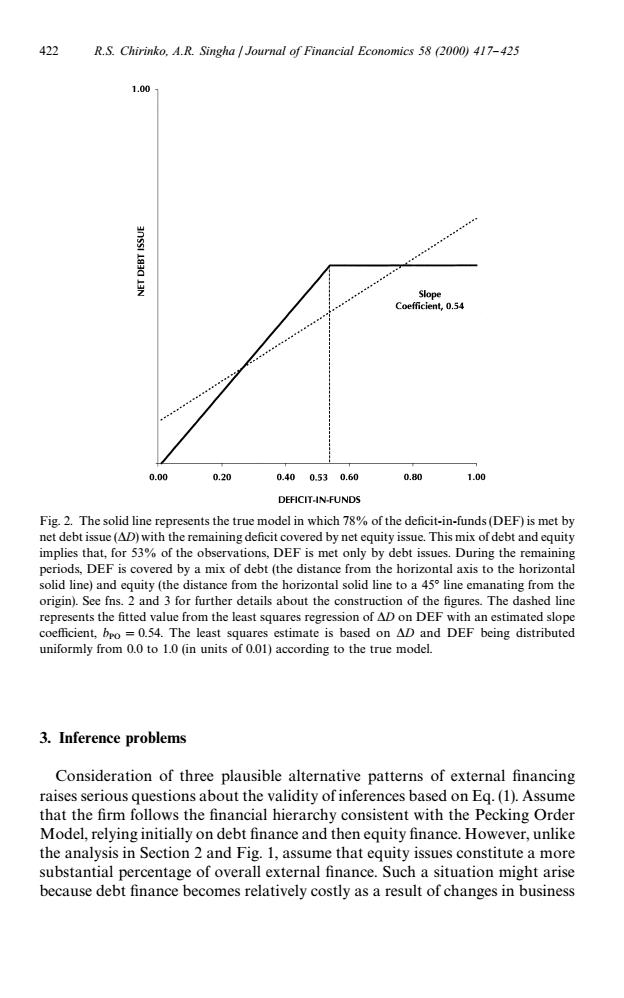
422 R.S.Chirinko,A.R.Singha Journal of Financial Economics 58 (2000)417-425 1.00 Slope Coefficient,0.54 0.00 0.20 0.400.530.60 0.80 1.00 DEFICIT-IN-FUNDS Fig.2.The solid line represents the true model in which 78%of the deficit-in-funds(DEF)is met by net debt issue(AD)with the remaining deficit covered by net equity issue.This mix of debt and equity implies that,for 53%of the observations,DEF is met only by debt issues.During the remaining periods,DEF is covered by a mix of debt(the distance from the horizontal axis to the horizontal solid line)and equity (the distance from the horizontal solid line to a 45 line emanating from the origin).See fns.2 and 3 for further details about the construction of the figures.The dashed line represents the fitted value from the least squares regression of AD on DEF with an estimated slope coefficient,bpo =0.54.The least squares estimate is based on AD and DEF being distributed uniformly from 0.0 to 1.0 (in units of 0.01)according to the true model. 3.Inference problems Consideration of three plausible alternative patterns of external financing raises serious questions about the validity of inferences based on Eq.(1).Assume that the firm follows the financial hierarchy consistent with the Pecking Order Model,relying initially on debt finance and then equity finance.However,unlike the analysis in Section 2 and Fig.1,assume that equity issues constitute a more substantial percentage of overall external finance.Such a situation might arise because debt finance becomes relatively costly as a result of changes in businessFig. 2. The solid line represents the true model in which 78% of the de"cit-in-funds (DEF) is met by net debt issue (*D) with the remaining de"cit covered by net equity issue. This mix of debt and equity implies that, for 53% of the observations, DEF is met only by debt issues. During the remaining periods, DEF is covered by a mix of debt (the distance from the horizontal axis to the horizontal solid line) and equity (the distance from the horizontal solid line to a 453 line emanating from the origin). See fns. 2 and 3 for further details about the construction of the "gures. The dashed line represents the "tted value from the least squares regression of *D on DEF with an estimated slope coe$cient, b PO"0.54. The least squares estimate is based on *D and DEF being distributed uniformly from 0.0 to 1.0 (in units of 0.01) according to the true model. 3. Inference problems Consideration of three plausible alternative patterns of external "nancing raises serious questions about the validity of inferences based on Eq. (1). Assume that the "rm follows the "nancial hierarchy consistent with the Pecking Order Model, relying initially on debt "nance and then equity "nance. However, unlike the analysis in Section 2 and Fig. 1, assume that equity issues constitute a more substantial percentage of overall external "nance. Such a situation might arise because debt "nance becomes relatively costly as a result of changes in business 422 R.S. Chirinko, A.R. Singha / Journal of Financial Economics 58 (2000) 417}425