正在加载图片...
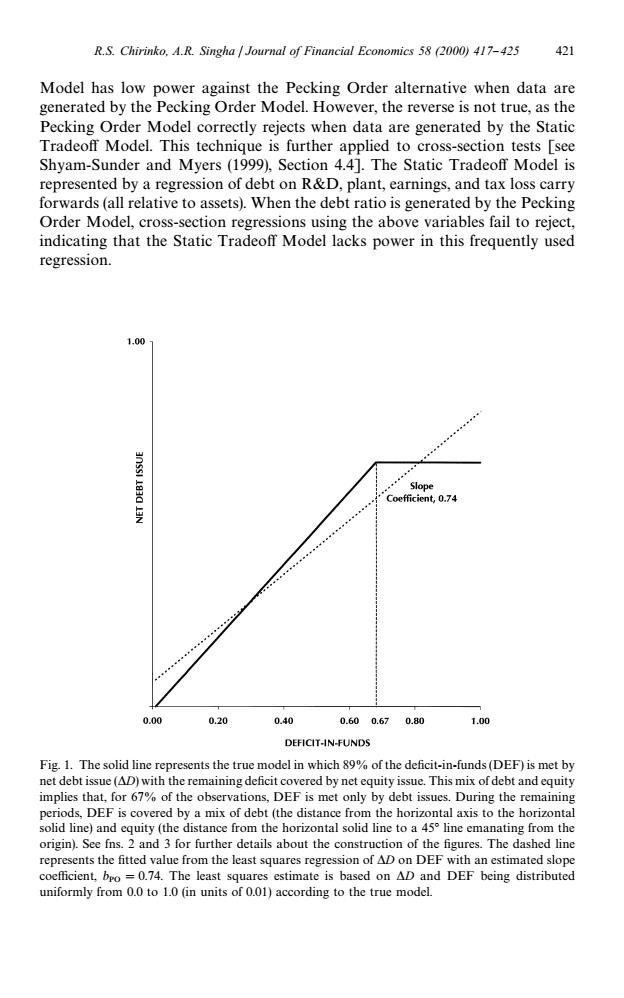
R.S.Chirinko.A.R.Singha Journal of Financial Economics 58 (2000)417-425 421 Model has low power against the Pecking Order alternative when data are generated by the Pecking Order Model.However,the reverse is not true,as the Pecking Order Model correctly rejects when data are generated by the Static Tradeoff Model.This technique is further applied to cross-section tests [see Shyam-Sunder and Myers(1999),Section 4.4].The Static Tradeoff Model is represented by a regression of debt on R&D,plant,earnings,and tax loss carry forwards(all relative to assets).When the debt ratio is generated by the Pecking Order Model,cross-section regressions using the above variables fail to reject, indicating that the Static Tradeoff Model lacks power in this frequently used regression. 1.00 Slope Coefficient,0.74 0.00 0.20 0.40 0.600.670.80 1.00 DEFICIT-IN-FUNDS Fig.1.The solid line represents the true model in which 89%of the deficit-in-funds(DEF)is met by net debt issue(AD)with the remaining deficit covered by net equity issue.This mix of debt and equity implies that,for 67%of the observations,DEF is met only by debt issues.During the remaining periods,DEF is covered by a mix of debt (the distance from the horizontal axis to the horizontal solid line)and equity (the distance from the horizontal solid line to a 45 line emanating from the origin).See fns.2 and 3 for further details about the construction of the figures.The dashed line represents the fitted value from the least squares regression of AD on DEF with an estimated slope coefficient,bpo =0.74.The least squares estimate is based on AD and DEF being distributed uniformly from 0.0 to 1.0 (in units of 0.01)according to the true model.Fig. 1. The solid line represents the true model in which 89% of the de"cit-in-funds (DEF) is met by net debt issue (*D) with the remaining de"cit covered by net equity issue. This mix of debt and equity implies that, for 67% of the observations, DEF is met only by debt issues. During the remaining periods, DEF is covered by a mix of debt (the distance from the horizontal axis to the horizontal solid line) and equity (the distance from the horizontal solid line to a 453 line emanating from the origin). See fns. 2 and 3 for further details about the construction of the "gures. The dashed line represents the "tted value from the least squares regression of *D on DEF with an estimated slope coe$cient, b PO"0.74. The least squares estimate is based on *D and DEF being distributed uniformly from 0.0 to 1.0 (in units of 0.01) according to the true model. Model has low power against the Pecking Order alternative when data are generated by the Pecking Order Model. However, the reverse is not true, as the Pecking Order Model correctly rejects when data are generated by the Static Tradeo! Model. This technique is further applied to cross-section tests [see Shyam-Sunder and Myers (1999), Section 4.4]. The Static Tradeo! Model is represented by a regression of debt on R&D, plant, earnings, and tax loss carry forwards (all relative to assets). When the debt ratio is generated by the Pecking Order Model, cross-section regressions using the above variables fail to reject, indicating that the Static Tradeo! Model lacks power in this frequently used regression. R.S. Chirinko, A.R. Singha / Journal of Financial Economics 58 (2000) 417}425 421