正在加载图片...
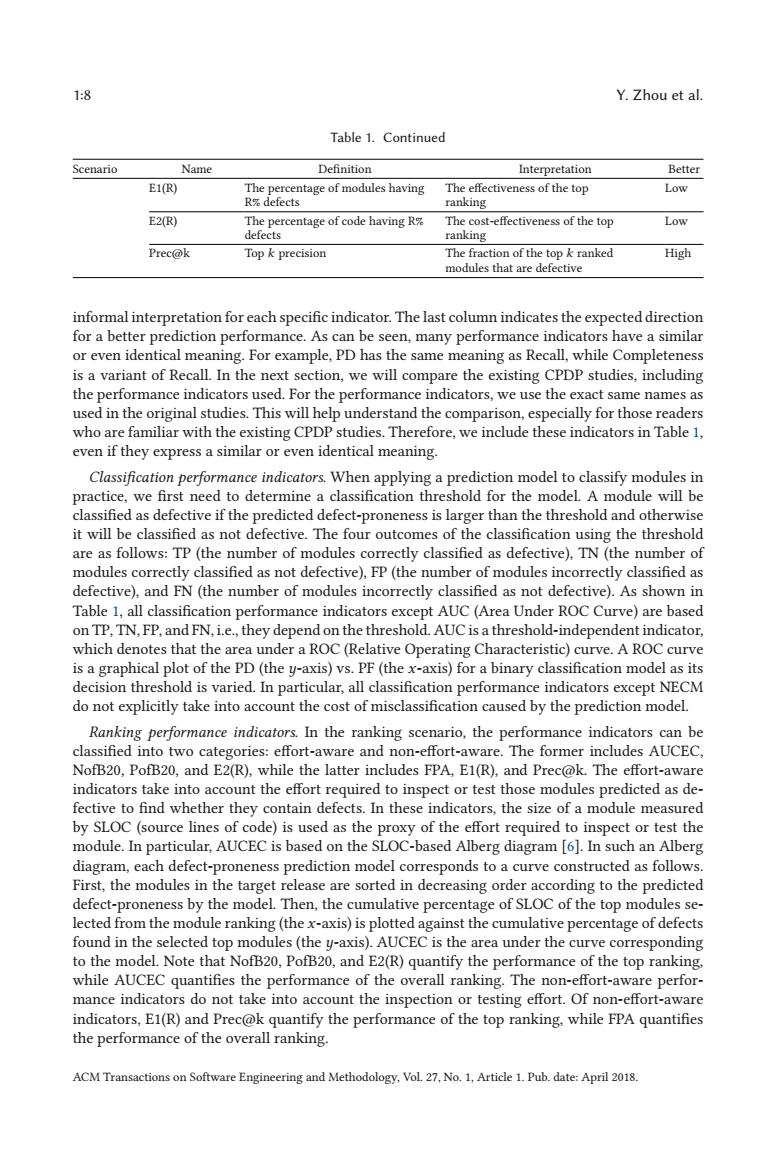
1:8 Y.Zhou et al. Table 1.Continued Scenario Name Definition Interpretation Better E1(R) The percentage of modules having The effectiveness of the top Low R%defects ranking E2(R) The percentage of code having R The cost-effectiveness of the top Low defects ranking Prec@k Top k precision The fraction of the top k ranked High modules that are defective informal interpretation for each specific indicator.The last column indicates the expected direction for a better prediction performance.As can be seen,many performance indicators have a similar or even identical meaning.For example,PD has the same meaning as Recall,while Completeness is a variant of Recall.In the next section,we will compare the existing CPDP studies,including the performance indicators used.For the performance indicators,we use the exact same names as used in the original studies.This will help understand the comparison,especially for those readers who are familiar with the existing CPDP studies.Therefore,we include these indicators in Table 1, even if they express a similar or even identical meaning. Classification performance indicators.When applying a prediction model to classify modules in practice,we first need to determine a classification threshold for the model.A module will be classified as defective if the predicted defect-proneness is larger than the threshold and otherwise it will be classified as not defective.The four outcomes of the classification using the threshold are as follows:TP(the number of modules correctly classified as defective),TN(the number of modules correctly classified as not defective),FP(the number of modules incorrectly classified as defective),and FN(the number of modules incorrectly classified as not defective).As shown in Table 1,all classification performance indicators except AUC (Area Under ROC Curve)are based on TP,TN,FP,and FN,i.e.,they depend on the threshold.AUC is a threshold-independent indicator, which denotes that the area under a ROC(Relative Operating Characteristic)curve.A ROC curve is a graphical plot of the PD(the y-axis)vs.PF(the x-axis)for a binary classification model as its decision threshold is varied.In particular,all classification performance indicators except NECM do not explicitly take into account the cost of misclassification caused by the prediction model. Ranking performance indicators.In the ranking scenario,the performance indicators can be classified into two categories:effort-aware and non-effort-aware.The former includes AUCEC, NofB20,PofB20,and E2(R),while the latter includes FPA,E1(R),and Prec@k.The effort-aware indicators take into account the effort required to inspect or test those modules predicted as de- fective to find whether they contain defects.In these indicators,the size of a module measured by SLOC (source lines of code)is used as the proxy of the effort required to inspect or test the module.In particular,AUCEC is based on the SLOC-based Alberg diagram [6].In such an Alberg diagram,each defect-proneness prediction model corresponds to a curve constructed as follows. First,the modules in the target release are sorted in decreasing order according to the predicted defect-proneness by the model.Then,the cumulative percentage of SLOC of the top modules se- lected from the module ranking(the x-axis)is plotted against the cumulative percentage of defects found in the selected top modules(the y-axis).AUCEC is the area under the curve corresponding to the model.Note that NofB20,PofB20,and E2(R)quantify the performance of the top ranking. while AUCEC quantifies the performance of the overall ranking.The non-effort-aware perfor- mance indicators do not take into account the inspection or testing effort.Of non-effort-aware indicators,E1(R)and Prec@k quantify the performance of the top ranking,while FPA quantifies the performance of the overall ranking. ACM Transactions on Software Engineering and Methodology,Vol.27,No.1,Article 1.Pub.date:April 2018.1:8 Y. Zhou et al. Table 1. Continued Scenario Name Definition Interpretation Better E1(R) The percentage of modules having R% defects The effectiveness of the top ranking Low E2(R) The percentage of code having R% defects The cost-effectiveness of the top ranking Low Prec@k Top k precision The fraction of the top k ranked modules that are defective High informal interpretation for each specific indicator. The last column indicates the expected direction for a better prediction performance. As can be seen, many performance indicators have a similar or even identical meaning. For example, PD has the same meaning as Recall, while Completeness is a variant of Recall. In the next section, we will compare the existing CPDP studies, including the performance indicators used. For the performance indicators, we use the exact same names as used in the original studies. This will help understand the comparison, especially for those readers who are familiar with the existing CPDP studies. Therefore, we include these indicators in Table 1, even if they express a similar or even identical meaning. Classification performance indicators. When applying a prediction model to classify modules in practice, we first need to determine a classification threshold for the model. A module will be classified as defective if the predicted defect-proneness is larger than the threshold and otherwise it will be classified as not defective. The four outcomes of the classification using the threshold are as follows: TP (the number of modules correctly classified as defective), TN (the number of modules correctly classified as not defective), FP (the number of modules incorrectly classified as defective), and FN (the number of modules incorrectly classified as not defective). As shown in Table 1, all classification performance indicators except AUC (Area Under ROC Curve) are based on TP, TN, FP, and FN, i.e., they depend on the threshold. AUC is a threshold-independent indicator, which denotes that the area under a ROC (Relative Operating Characteristic) curve. A ROC curve is a graphical plot of the PD (the y-axis) vs. PF (the x-axis) for a binary classification model as its decision threshold is varied. In particular, all classification performance indicators except NECM do not explicitly take into account the cost of misclassification caused by the prediction model. Ranking performance indicators. In the ranking scenario, the performance indicators can be classified into two categories: effort-aware and non-effort-aware. The former includes AUCEC, NofB20, PofB20, and E2(R), while the latter includes FPA, E1(R), and Prec@k. The effort-aware indicators take into account the effort required to inspect or test those modules predicted as defective to find whether they contain defects. In these indicators, the size of a module measured by SLOC (source lines of code) is used as the proxy of the effort required to inspect or test the module. In particular, AUCEC is based on the SLOC-based Alberg diagram [6]. In such an Alberg diagram, each defect-proneness prediction model corresponds to a curve constructed as follows. First, the modules in the target release are sorted in decreasing order according to the predicted defect-proneness by the model. Then, the cumulative percentage of SLOC of the top modules selected from the module ranking (the x-axis) is plotted against the cumulative percentage of defects found in the selected top modules (the y-axis). AUCEC is the area under the curve corresponding to the model. Note that NofB20, PofB20, and E2(R) quantify the performance of the top ranking, while AUCEC quantifies the performance of the overall ranking. The non-effort-aware performance indicators do not take into account the inspection or testing effort. Of non-effort-aware indicators, E1(R) and Prec@k quantify the performance of the top ranking, while FPA quantifies the performance of the overall ranking. ACM Transactions on Software Engineering and Methodology, Vol. 27, No. 1, Article 1. Pub. date: April 2018