正在加载图片...
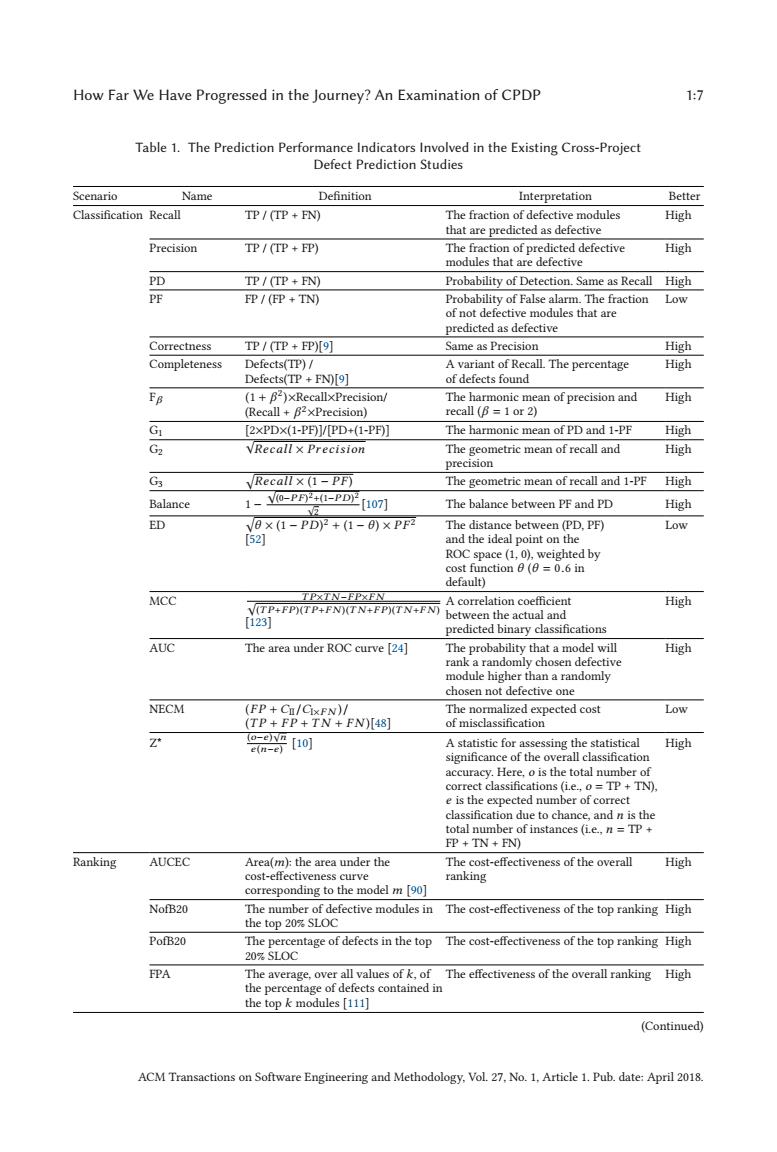
How Far We Have Progressed in the Journey?An Examination of CPDP 1:7 Table 1.The Prediction Performance Indicators Involved in the Existing Cross-Project Defect Prediction Studies Scenario Name Definition Interpretation Better Classification Recall IP/(TP FN) The fraction of defective modules High that are predicted as defective Precision TP /(TP FP) The fraction of predicted defective High modules that are defective PD TP/(TP +FN) Probability of Detection.Same as Recall High PF FP/(FP +TN) Probability of False alarm.The fraction Low of not defective modules that are predicted as defective Correctness TP/(TP FP)[9] Same as Precision High Completeness Defects(TP)/ A variant of Recall.The percentage High Defects(TP+FN)[9] of defects found FB (1+B2)xRecallxPrecision/ The harmonic mean of precision and High (Recall B2xPrecision) recall (B 1 or 2) G [2xPDX(1-PF)]/[PD+(1-PF)] The harmonic mean of PD and 1-PF High Gz VRecall x Precision The geometric mean of recall and High precision G3 Recall x (1-PF) The geometric mean of recall and 1-PF High Balance 1-Y0-PP4-PD[107 The balance between PF and PD High ED VB×(1-PDP+(1-6)×PF网 The distance between(PD,PF) Low [52 and the ideal point on the ROC space(1,0),weighted by cost function =0.6 in default) MCC TPXTN-EPXEN A correlation coefficient V(TP+FP)(TP+FN)(TN+FP)(TN+FN) High between the actual and T123] predicted binary classifications AUC The area under ROC curve [24] The probability that a model will High rank a randomly chosen defective module higher than a randomly chosen not defective one NECM (FP+C/CIxFN)/ The normalized expected cost Low (TP+FP+TN+FN)[48] of misclassification Z 晋可 A statistic for assessing the statistical High significance of the overall classification accuracy.Here,o is the total number of correct classifications (i.e.,o TP+TN) e is the expected number of correct classification due to chance,and n is the total number of instances (i.e.,n TP FP TN+FN) Ranking AUCEC Area(m):the area under the The cost-effectiveness of the overall High cost-effectiveness curve ranking corresponding to the model m [90] NofB20 The number of defective modules in The cost-effectiveness of the top ranking High the top 20%SLOC PofB20 The percentage of defects in the top The cost-effectiveness of the top ranking High 20%SLOC FPA The average,over all values of k,of The effectiveness of the overall ranking High the percentage of defects contained in the top k modules [111] (Continued) ACM Transactions on Software Engineering and Methodology,Vol.27.No.1,Article 1.Pub.date:April 2018.How Far We Have Progressed in the Journey? An Examination of CPDP 1:7 Table 1. The Prediction Performance Indicators Involved in the Existing Cross-Project Defect Prediction Studies Scenario Name Definition Interpretation Better Classification Recall TP / (TP + FN) The fraction of defective modules that are predicted as defective High Precision TP / (TP + FP) The fraction of predicted defective modules that are defective High PD TP / (TP + FN) Probability of Detection. Same as Recall High PF FP / (FP + TN) Probability of False alarm. The fraction of not defective modules that are predicted as defective Low Correctness TP / (TP + FP)[9] Same as Precision High Completeness Defects(TP) / Defects(TP + FN)[9] A variant of Recall. The percentage of defects found High Fβ (1 + β2)×Recall×Precision/ (Recall + β2×Precision) The harmonic mean of precision and recall (β = 1 or 2) High G1 [2×PD×(1-PF)]/[PD+(1-PF)] The harmonic mean of PD and 1-PF High G2 √ Recall × Precision The geometric mean of recall and precision High G3 Recall × (1 − P F ) The geometric mean of recall and 1-PF High Balance 1 − √ (0−P F )2+(1−P D)2 √ 2 [107] The balance between PF and PD High ED θ × (1 − P D)2 + (1 − θ ) × P F 2 [52] The distance between (PD, PF) and the ideal point on the ROC space (1, 0), weighted by cost function θ (θ = 0.6 in default) Low MCC √ T P×T N −F P×F N (T P+F P )(T P+F N )(T N +F P )(T N +F N ) [123] A correlation coefficient between the actual and predicted binary classifications High AUC The area under ROC curve [24] The probability that a model will rank a randomly chosen defective module higher than a randomly chosen not defective one High NECM (F P + CII/CI×F N )/ (T P + F P + T N + F N )[48] The normalized expected cost of misclassification Low Z* (o−e ) √ n e (n−e ) [10] A statistic for assessing the statistical significance of the overall classification accuracy. Here, o is the total number of correct classifications (i.e., o = TP + TN), e is the expected number of correct classification due to chance, and n is the total number of instances (i.e., n = TP + FP + TN + FN) High Ranking AUCEC Area(m): the area under the cost-effectiveness curve corresponding to the model m [90] The cost-effectiveness of the overall ranking High NofB20 The number of defective modules in the top 20% SLOC The cost-effectiveness of the top ranking High PofB20 The percentage of defects in the top 20% SLOC The cost-effectiveness of the top ranking High FPA The average, over all values of k, of the percentage of defects contained in the top k modules [111] The effectiveness of the overall ranking High (Continued) ACM Transactions on Software Engineering and Methodology, Vol. 27, No. 1, Article 1. Pub. date: April 2018.��