正在加载图片...

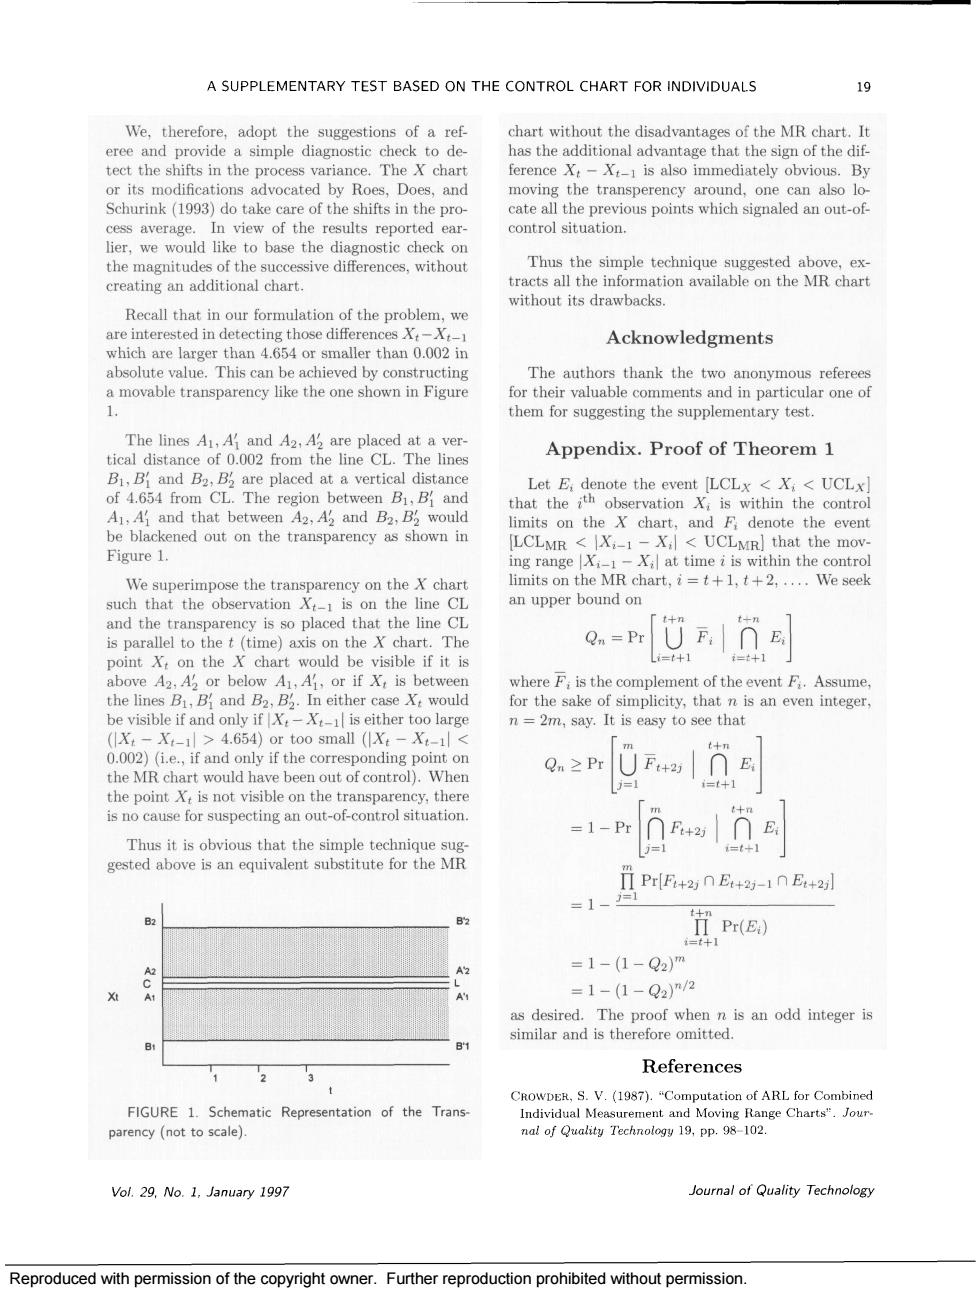
A SUPPLEMENTARY TEST BASED ON THE CONTROL CHART FOR INDIVIDUALS 19 We, tect the shifts in the process variance.The chart ference X. -X is also immediately obvious.By s in of the lier.we would like to base the diagnostic check on onal chart without its drawbacks. Recall that in our formulation of the problem.we are interested in Acknowledgments thank the two anont a movable transparency like the one shown in Figure for their in particular one of hem for suggesting the supplementary test. The lines A tical distance of002 from the line CL The line Appendix.Proof of Theorem 1 UCL Th nd thar be blackened out on the tranprency the even Figure 1 ng ra MR X X at time is within the ro the tra on the char limits on the MR chart,+.We seek an upper bound or Qn=PrUF∩E hart =41 4+】 above2.or below,or if is between where F,is the complement of the event F.Assume and either cas e X:woule 4.654)or too small ( 0.002)(ie.,if and only if the corresponding po t on he MR c ond have been out of control). suspecting an out-of control situation Ttsoinetheeteieqe =1-Pr门R+aTE ges ove Is al eql TI PrF20E+2-10E+2] 1- II Pr(E.) =1-(1-Q2)m =1-(1-Q2)n/2 as desired.The proof when n is an odd integer is similar and is therefore omitted. 2 References S.V (1987)."Computation of ARL for Combine FIGURE 1.Schematic Representation of the Trans parency(not to scale) Vol.29,No.1.January 1997 Journal of Quality Technology Reproduced with permission of the copyright owner.Further reproduction prohibited without permission.Reproduced with permission of the copyright owner. Further reproduction prohibited without permission