正在加载图片...

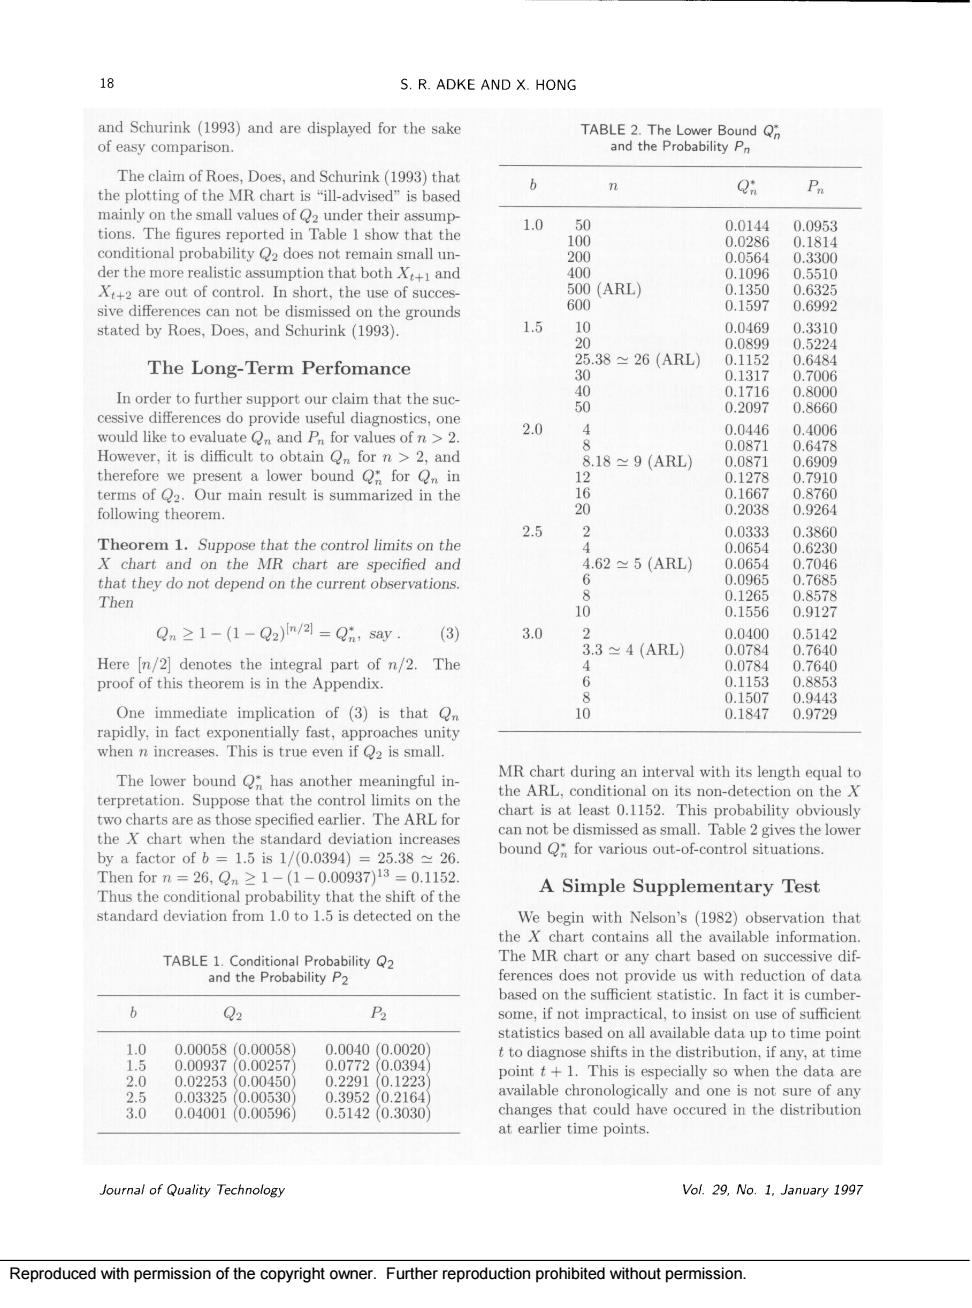
18 S.R.ADKE AND X.HONG and Schurink (1993)and are displayed for the sake of easy comparison. oand Schurink (1993)tha b Q: mainly on the small values of under their assu tions.The figure 1.0 0.0144 0.0953 ierdiomalprol ty2doesnotrepainualr 0.109 X+2 are out of control.In short.the use of succes 0150 D(0 sive differ 1.5 .06 033 The Long-Term Perfomance 25.38≈26(ARL) 0.1152 nodatorte5ppotorchimthathesc 8 would like to evaluate and P.for values of 2.0 However,it is difficult to obtain for n>2,and 8.18≈9(ARL the following theorem. 2.5 2 8 hat they d Then Qn≥1-(1-Q2)n/=Q,ay (3) 3.0 The 3.3≈4(ARL One immediate implication of (3)is that Q MR chart duri The lower bound O*has another meaningful in- hart is at least 0.1 52 bound for out-ofconrosituations lowe by a factor ofb=1.5is1/0.0394)=25.3826 Then for n= -0.0093 A Simple Supplementary Test We begin with Nelson's (1982)obs vation that the chart contains all the available information TABLE 1.Conditional Probability Q2 The MR chart or any chart based on successive dif and the Probability P2 some,if not impractical,to insist on use of sufficient ata up to time poin 0.000580.0005 0.00400.0020 point.This is when the datar 2 0.040010.00596 0.51420.3030 alaleoc the t cou Journal of Quality Technology Vol.29,No.1.January 1997 Reproduced with permission of the copyright owner.Further tion or hibited without permission. Reproduced with permission of the copyright owner. Further reproduction prohibited without permission