正在加载图片...
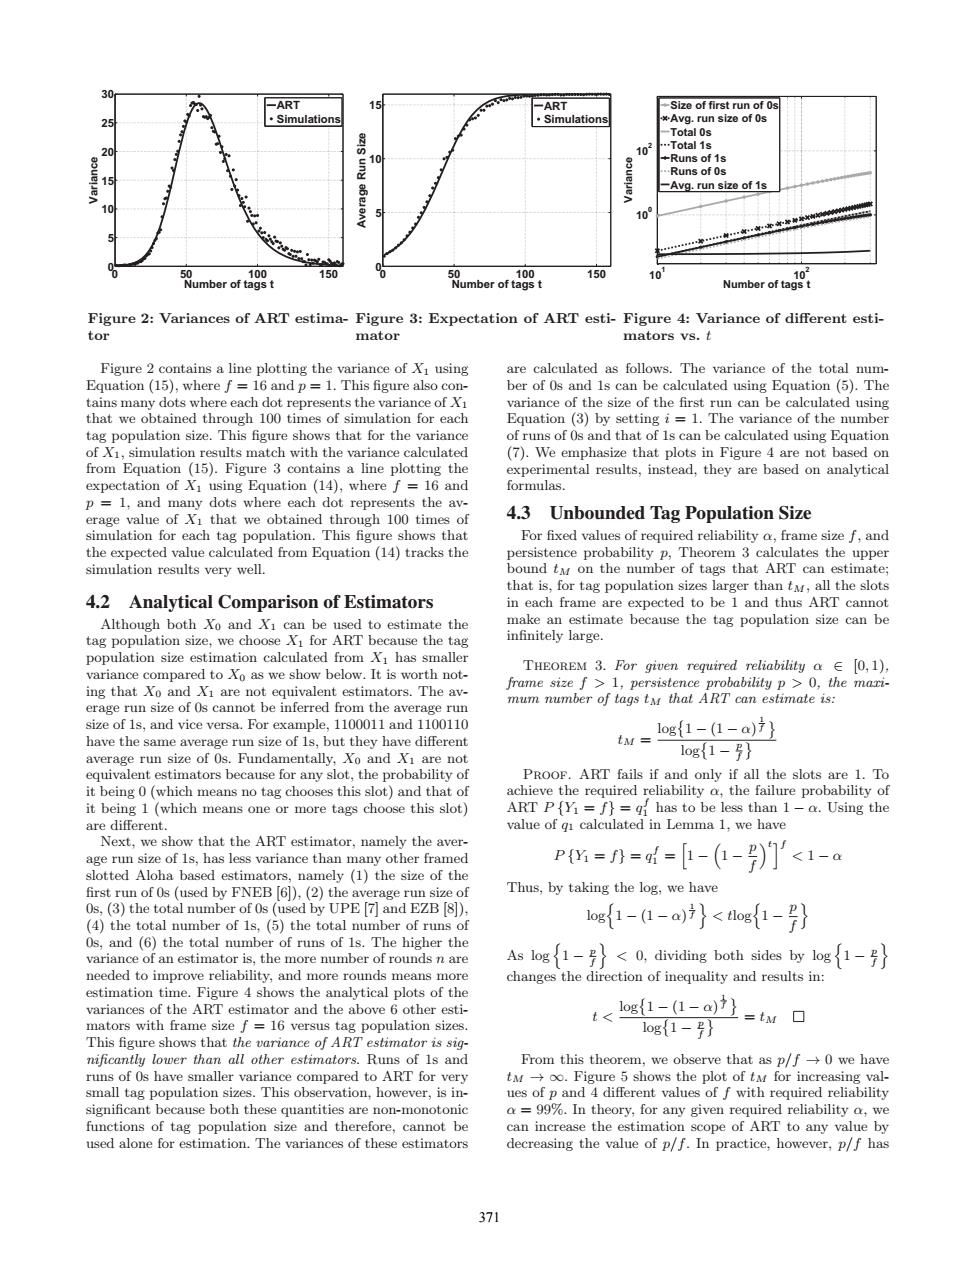
-ART -ART →Size of first run of0s ·Simulations Simulations Avg.run size of 0s -Total 0s 101 …Total1s 10 8 +Runs of 1s Runs of 0s -Avg.run size of 1s 10 Number of tag 100 150 umber oftagst 100 150 10 Number of tag Figure 2:Variances of ART estima-Figure 3:Expectation of ART esti-Figure 4:Variance of different esti- tor mator mators vs.t Figure 2 contains a line plotting the variance of xI using are calculated as follows.The variance of the total num- Equation (15),where f=16 and p=1.This figure also con- ber of 0s and 1s can be calculated using Equation (5).The tains many dots where each dot represents the variance of Xi variance of the size of the first run can be calculated using that we obtained through 100 times of simulation for each Equation (3)by setting i =1.The variance of the number tag population size.This figure shows that for the variance of runs of Os and that of Is can be calculated using Equation of X1,simulation results match with the variance calculated (7).We emphasize that plots in Figure 4 are not based on from Equation (15).Figure 3 contains a line plotting the experimental results,instead,they are based on analytical expectation of XI using Equation (14),where f 16 and formulas. p 1,and many dots where each dot represents the av- erage value of Xi that we obtained through 100 times of 4.3 Unbounded Tag Population Size simulation for each tag population.This figure shows that For fixed values of required reliability o,frame size f,and the expected value calculated from Equation(14)tracks the persistence probability p,Theorem 3 calculates the upper simulation results very well. bound tu on the number of tags that ART can estimate; that is,for tag population sizes larger than tM,all the slots 4.2 Analytical Comparison of Estimators in each frame are expected to be 1 and thus ART cannot Although both Xo and Xi can be used to estimate the make an estimate because the tag population size can be tag population size,we choose Xi for ART because the tag infinitely large population size estimation calculated from Xi has smaller variance compared to Xo as we show below.It is worth not- THEOREM 3.For given required reliability a E 0,1), ing that Xo and Xi are not equivalent estimators.The av- frame size f>1,persistence probability p>0,the mari- erage run size of 0s cannot be inferred from the average run mum number of tags tM that ART can estimate is: size of 1s,and vice versa.For example,1100011 and 1100110 log{1-(1-a)7} have the same average run size of 1s,but they have different tM= average run size of 0s.Fundamentally,Xo and Xi are not 1og{1-} equivalent estimators because for any slot,the probability of PROOF.ART fails if and only if all the slots are 1.To it being 0(which means no tag chooses this slot)and that of achieve the required reliability a,the failure probability of it being 1(which means one or more tags choose this slot) ART P{Yi=f)=qf has to be less than 1-a.Using the are different. value of gi calculated in Lemma 1.we have Next,we show that the ART estimator.namely the aver- age run size of 1s,has less variance than many other framed P===-(-)门 <1-a slotted Aloha based estimators,namely (1)the size of the first run of 0s(used by FNEB [6]),(2)the average run size of Thus,by taking the log,we have 0s,(3)the total number of 0s(used by UPE [7]and EZB [8]), (4)the total number of 1s,(5)the total number of runs of 1og1-1-a)}<og1-f} 0s,and (6)the total number of runs of 1s.The higher the variance of an estimator is,the more number of rounds n are As log{1-号}<0,dividing both sides by log{1-号} needed to improve reliability,and more rounds means more changes the direction of inequality and results in: estimation time.Figure 4 shows the analytical plots of the variances of the ART estimator and the above 6 other esti- t< mators with frame size f=16 versus tag population sizes. osL-1-a边}=tw口 1og{1-号} This figure shows that the variance of ART estimator is sig- mificantly lower than all other estimators.Runs of 1s and From this theorem,we observe that as p/f-0 we have runs of 0s have smaller variance compared to ART for very t-oo.Figure 5 shows the plot of ta for increasing val- small tag population sizes.This observation,however,is in- ues of p and 4 different values of f with required reliability significant because both these quantities are non-monotonic a=99%.In theory,for any given required reliability a,we functions of tag population size and therefore,cannot be can increase the estimation scope of ART to any value by used alone for estimation.The variances of these estimators decreasing the value of p/f.In practice,however,p/f has 3710 50 100 150 0 5 10 15 20 25 30 Number of tags t Variance ART Simulations Figure 2: Variances of ART estimator 0 50 100 150 0 5 10 15 Number of tags t Average Run Size ART Simulations Figure 3: Expectation of ART estimator 101 102 100 102 Number of tags t Variance Size of first run of 0s Avg. run size of 0s Total 0s Total 1s Runs of 1s Runs of 0s Avg. run size of 1s Figure 4: Variance of different estimators vs. t Figure 2 contains a line plotting the variance of X1 using Equation (15), where f = 16 and p = 1. This figure also contains many dots where each dot represents the variance of X1 that we obtained through 100 times of simulation for each tag population size. This figure shows that for the variance of X1, simulation results match with the variance calculated from Equation (15). Figure 3 contains a line plotting the expectation of X1 using Equation (14), where f = 16 and p = 1, and many dots where each dot represents the average value of X1 that we obtained through 100 times of simulation for each tag population. This figure shows that the expected value calculated from Equation (14) tracks the simulation results very well. 4.2 Analytical Comparison of Estimators Although both X0 and X1 can be used to estimate the tag population size, we choose X1 for ART because the tag population size estimation calculated from X1 has smaller variance compared to X0 as we show below. It is worth noting that X0 and X1 are not equivalent estimators. The average run size of 0s cannot be inferred from the average run size of 1s, and vice versa. For example, 1100011 and 1100110 have the same average run size of 1s, but they have different average run size of 0s. Fundamentally, X0 and X1 are not equivalent estimators because for any slot, the probability of it being 0 (which means no tag chooses this slot) and that of it being 1 (which means one or more tags choose this slot) are different. Next, we show that the ART estimator, namely the average run size of 1s, has less variance than many other framed slotted Aloha based estimators, namely (1) the size of the first run of 0s (used by FNEB [6]), (2) the average run size of 0s, (3) the total number of 0s (used by UPE [7] and EZB [8]), (4) the total number of 1s, (5) the total number of runs of 0s, and (6) the total number of runs of 1s. The higher the variance of an estimator is, the more number of rounds n are needed to improve reliability, and more rounds means more estimation time. Figure 4 shows the analytical plots of the variances of the ART estimator and the above 6 other estimators with frame size f = 16 versus tag population sizes. This figure shows that the variance of ART estimator is significantly lower than all other estimators. Runs of 1s and runs of 0s have smaller variance compared to ART for very small tag population sizes. This observation, however, is insignificant because both these quantities are non-monotonic functions of tag population size and therefore, cannot be used alone for estimation. The variances of these estimators are calculated as follows. The variance of the total number of 0s and 1s can be calculated using Equation (5). The variance of the size of the first run can be calculated using Equation (3) by setting i = 1. The variance of the number of runs of 0s and that of 1s can be calculated using Equation (7). We emphasize that plots in Figure 4 are not based on experimental results, instead, they are based on analytical formulas. 4.3 Unbounded Tag Population Size For fixed values of required reliability α, frame size f, and persistence probability p, Theorem 3 calculates the upper bound tM on the number of tags that ART can estimate; that is, for tag population sizes larger than tM, all the slots in each frame are expected to be 1 and thus ART cannot make an estimate because the tag population size can be infinitely large. Theorem 3. For given required reliability α ∈ [0, 1), frame size f > 1, persistence probability p > 0, the maximum number of tags tM that ART can estimate is: tM = log 1 − (1 − α) 1 f log 1 − p f Proof. ART fails if and only if all the slots are 1. To achieve the required reliability α, the failure probability of ART P {Y1 = f} = qf 1 has to be less than 1 − α. Using the value of q1 calculated in Lemma 1, we have P {Y1 = f} = qf 1 = 1 − 1 − p f tf < 1 − α Thus, by taking the log, we have log 1 − (1 − α) 1 f < tlog 1 − p f As log 1 − p f < 0, dividing both sides by log 1 − p f changes the direction of inequality and results in: t < log 1 − (1 − α) 1 f log 1 − p f = tM From this theorem, we observe that as p/f → 0 we have tM → ∞. Figure 5 shows the plot of tM for increasing values of p and 4 different values of f with required reliability α = 99%. In theory, for any given required reliability α, we can increase the estimation scope of ART to any value by decreasing the value of p/f. In practice, however, p/f has 371��������