正在加载图片...

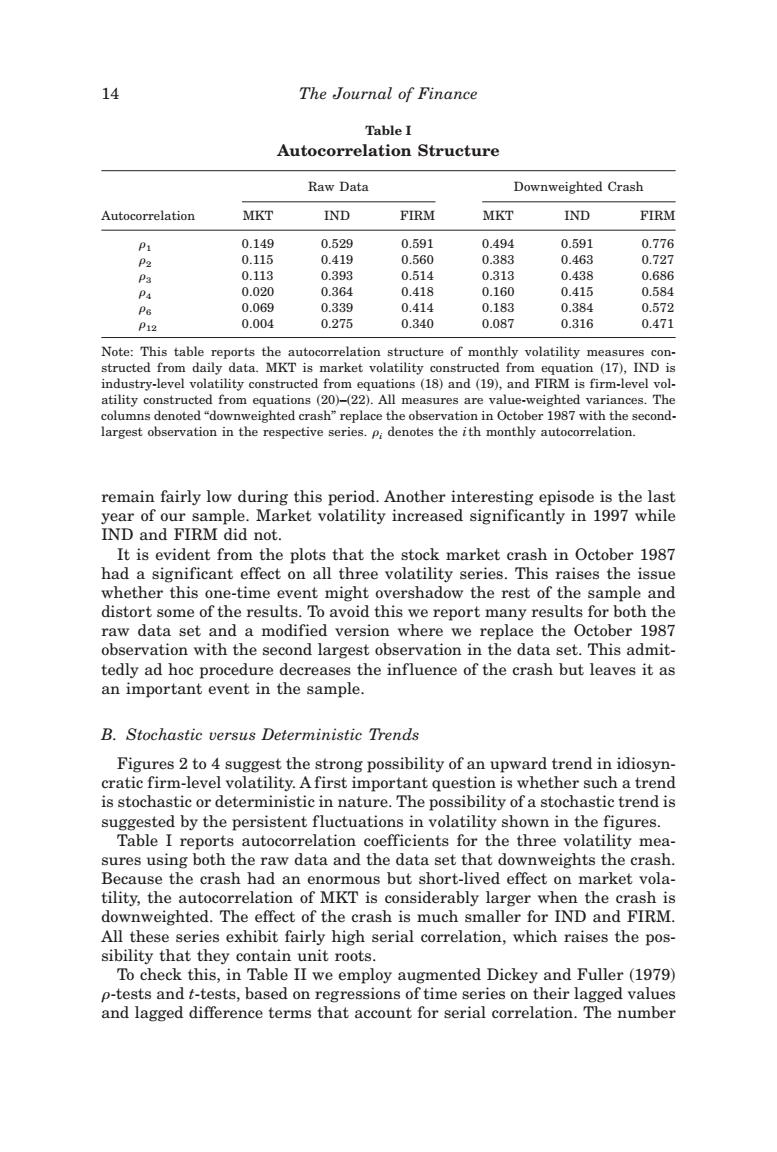
4 The Journal of Finance Table I Autocorrelation Structure Raw Data Downweighted Crash Autocorrelation MKT IND FIRM MKT IND FIRM P1 0.149 0.529 0.591 0.494 0.591 0.776 P2 0.115 0.419 0.560 0.383 0.463 0.727 P3 0.113 0.393 0.514 0.313 0.438 0.686 Pa 0.020 0.364 0.418 0.160 0.415 0.584 Pe 0.069 0.339 0.414 0.183 0.384 0.572 P12 0.004 0.275 0.340 0.087 0.316 0.471 Note:This table reports the autocorrelation structure of monthly volatility measures con- structed from daily data.MKT is market volatility constructed from equation (17),IND is industry-level volatility constructed from equations(18)and(19),and FIRM is firm-level vol- atility constructed from equations(20)-(22).All measures are value-weighted variances.The columns denoted"downweighted crash"replace the observation in October 1987 with the second- largest observation in the respective series.P:denotes the ith monthly autocorrelation. remain fairly low during this period.Another interesting episode is the last year of our sample.Market volatility increased significantly in 1997 while IND and FIRM did not. It is evident from the plots that the stock market crash in October 1987 had a significant effect on all three volatility series.This raises the issue whether this one-time event might overshadow the rest of the sample and distort some of the results.To avoid this we report many results for both the raw data set and a modified version where we replace the October 1987 observation with the second largest observation in the data set.This admit- tedly ad hoc procedure decreases the influence of the crash but leaves it as an important event in the sample. B.Stochastic versus Deterministic Trends Figures 2 to 4 suggest the strong possibility of an upward trend in idiosyn- cratic firm-level volatility.A first important question is whether such a trend is stochastic or deterministic in nature.The possibility of a stochastic trend is suggested by the persistent fluctuations in volatility shown in the figures. Table I reports autocorrelation coefficients for the three volatility mea- sures using both the raw data and the data set that downweights the crash. Because the crash had an enormous but short-lived effect on market vola- tility,the autocorrelation of MKT is considerably larger when the crash is downweighted.The effect of the crash is much smaller for IND and FIRM. All these series exhibit fairly high serial correlation,which raises the pos- sibility that they contain unit roots. To check this,in Table II we employ augmented Dickey and Fuller (1979) p-tests and t-tests,based on regressions of time series on their lagged values and lagged difference terms that account for serial correlation.The numberremain fairly low during this period. Another interesting episode is the last year of our sample. Market volatility increased significantly in 1997 while IND and FIRM did not. It is evident from the plots that the stock market crash in October 1987 had a significant effect on all three volatility series. This raises the issue whether this one-time event might overshadow the rest of the sample and distort some of the results. To avoid this we report many results for both the raw data set and a modified version where we replace the October 1987 observation with the second largest observation in the data set. This admittedly ad hoc procedure decreases the influence of the crash but leaves it as an important event in the sample. B. Stochastic versus Deterministic Trends Figures 2 to 4 suggest the strong possibility of an upward trend in idiosyncratic firm-level volatility. A first important question is whether such a trend is stochastic or deterministic in nature. The possibility of a stochastic trend is suggested by the persistent fluctuations in volatility shown in the figures. Table I reports autocorrelation coefficients for the three volatility measures using both the raw data and the data set that downweights the crash. Because the crash had an enormous but short-lived effect on market volatility, the autocorrelation of MKT is considerably larger when the crash is downweighted. The effect of the crash is much smaller for IND and FIRM. All these series exhibit fairly high serial correlation, which raises the possibility that they contain unit roots. To check this, in Table II we employ augmented Dickey and Fuller ~1979! r-tests and t-tests, based on regressions of time series on their lagged values and lagged difference terms that account for serial correlation. The number Table I Autocorrelation Structure Raw Data Downweighted Crash Autocorrelation MKT IND FIRM MKT IND FIRM r1 0.149 0.529 0.591 0.494 0.591 0.776 r2 0.115 0.419 0.560 0.383 0.463 0.727 r3 0.113 0.393 0.514 0.313 0.438 0.686 r4 0.020 0.364 0.418 0.160 0.415 0.584 r6 0.069 0.339 0.414 0.183 0.384 0.572 r12 0.004 0.275 0.340 0.087 0.316 0.471 Note: This table reports the autocorrelation structure of monthly volatility measures constructed from daily data. MKT is market volatility constructed from equation ~17!, IND is industry-level volatility constructed from equations ~18! and ~19!, and FIRM is firm-level volatility constructed from equations ~20!–~22!. All measures are value-weighted variances. The columns denoted “downweighted crash” replace the observation in October 1987 with the secondlargest observation in the respective series. ri denotes the ith monthly autocorrelation. 14 The Journal of Finance