正在加载图片...

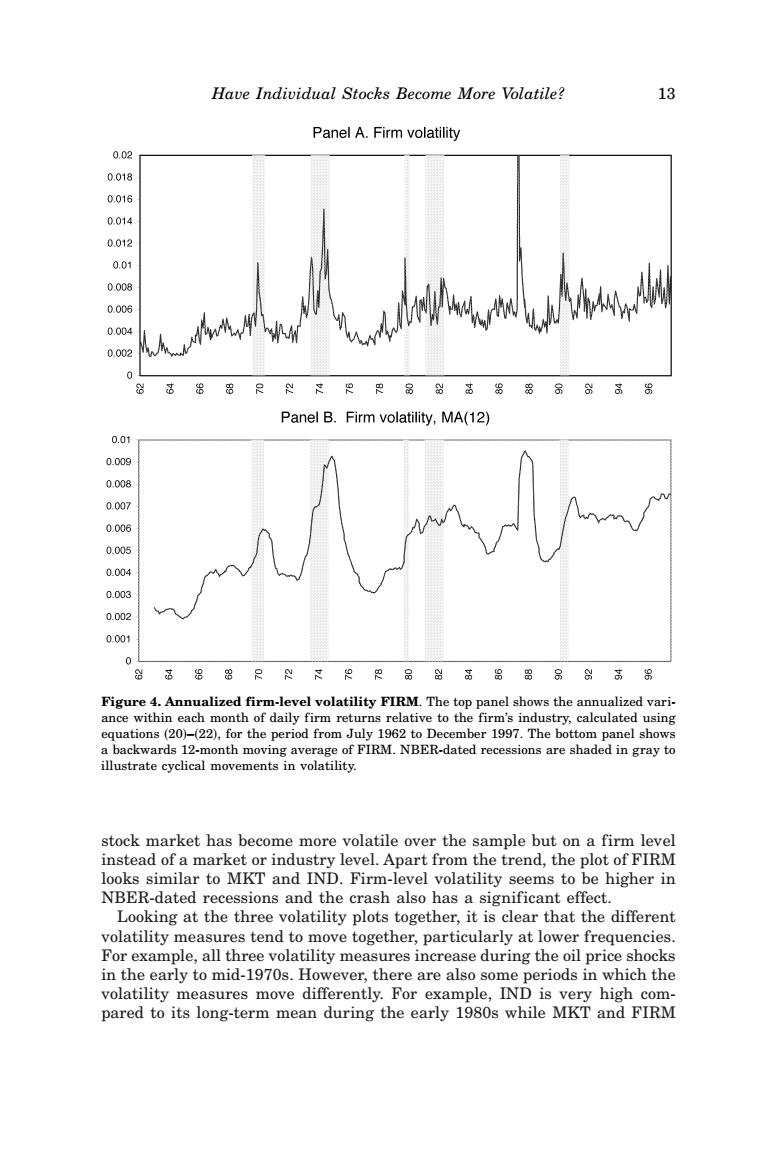
Have Individual Stocks Become More Volatile? 13 Panel A.Firm volatility 0.02 0.018 0.016 0.014 0.012 0.01 0.008 0.006 2ww 0.004 0.002 0 8 Panel B.Firm volatility,MA(12) 0.01 0.009 0.008 0.007 0.006 0.005 0.004 0.003 0.002 0.001 0 8留只g炽R品剑高品品品别高号 Figure 4.Annualized firm-level volatility FIRM.The top panel shows the annualized vari. ance within each month of daily firm returns relative to the firm's industry,calculated using equations (20)-(22),for the period from July 1962 to December 1997.The bottom panel shows a backwards 12-month moving average of FIRM.NBER-dated recessions are shaded in gray to illustrate cyclical movements in volatility. stock market has become more volatile over the sample but on a firm level instead of a market or industry level.Apart from the trend,the plot of FIRM looks similar to MKT and IND.Firm-level volatility seems to be higher in NBER-dated recessions and the crash also has a significant effect. Looking at the three volatility plots together,it is clear that the different volatility measures tend to move together,particularly at lower frequencies. For example,all three volatility measures increase during the oil price shocks in the early to mid-1970s.However,there are also some periods in which the volatility measures move differently.For example,IND is very high com- pared to its long-term mean during the early 1980s while MKT and FIRMstock market has become more volatile over the sample but on a firm level instead of a market or industry level. Apart from the trend, the plot of FIRM looks similar to MKT and IND. Firm-level volatility seems to be higher in NBER-dated recessions and the crash also has a significant effect. Looking at the three volatility plots together, it is clear that the different volatility measures tend to move together, particularly at lower frequencies. For example, all three volatility measures increase during the oil price shocks in the early to mid-1970s. However, there are also some periods in which the volatility measures move differently. For example, IND is very high compared to its long-term mean during the early 1980s while MKT and FIRM Figure 4. Annualized firm-level volatility FIRM. The top panel shows the annualized variance within each month of daily firm returns relative to the firm’s industry, calculated using equations ~20!–~22!, for the period from July 1962 to December 1997. The bottom panel shows a backwards 12-month moving average of FIRM. NBER-dated recessions are shaded in gray to illustrate cyclical movements in volatility. Have Individual Stocks Become More Volatile? 13