正在加载图片...

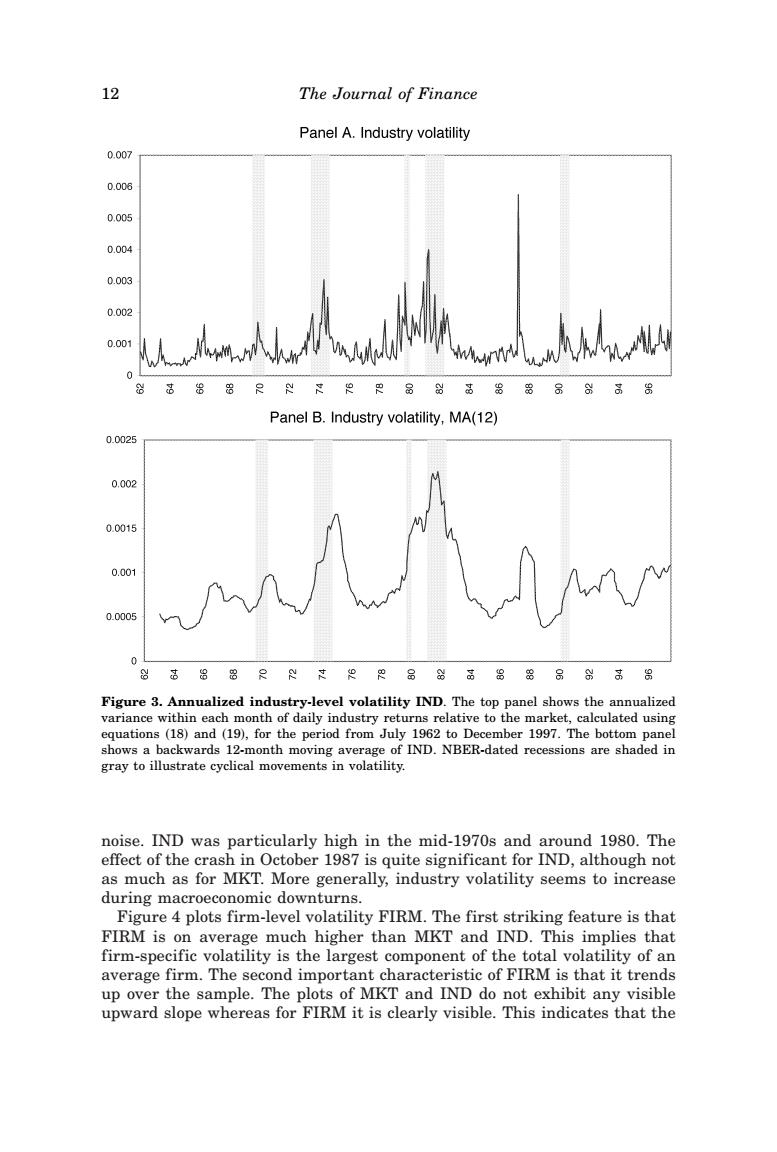
12 The Journal of Finance Panel A.Industry volatility 0.007 0.008 0.005 0.004 0.003 0.002 0.001 0 Panel B.Industry volatility,MA(12) 0.0025 0.002 0.0015 0.001 0.0005 0 铝器只科寸炽R品器高品88别高8 Figure 3.Annualized industry-level volatility IND.The top panel shows the annualized variance within each month of daily industry returns relative to the market,calculated using equations (18)and(19),for the period from July 1962 to December 1997.The bottom panel shows a backwards 12-month moving average of IND.NBER-dated recessions are shaded in gray to illustrate cyclical movements in volatility. noise.IND was particularly high in the mid-1970s and around 1980.The effect of the crash in October 1987 is quite significant for IND,although not as much as for MKT.More generally,industry volatility seems to increase during macroeconomic downturns. Figure 4 plots firm-level volatility FIRM.The first striking feature is that FIRM is on average much higher than MKT and IND.This implies that firm-specific volatility is the largest component of the total volatility of an average firm.The second important characteristic of FIRM is that it trends up over the sample.The plots of MKT and IND do not exhibit any visible upward slope whereas for FIRM it is clearly visible.This indicates that thenoise. IND was particularly high in the mid-1970s and around 1980. The effect of the crash in October 1987 is quite significant for IND, although not as much as for MKT. More generally, industry volatility seems to increase during macroeconomic downturns. Figure 4 plots firm-level volatility FIRM. The first striking feature is that FIRM is on average much higher than MKT and IND. This implies that firm-specific volatility is the largest component of the total volatility of an average firm. The second important characteristic of FIRM is that it trends up over the sample. The plots of MKT and IND do not exhibit any visible upward slope whereas for FIRM it is clearly visible. This indicates that the Figure 3. Annualized industry-level volatility IND. The top panel shows the annualized variance within each month of daily industry returns relative to the market, calculated using equations ~18! and ~19!, for the period from July 1962 to December 1997. The bottom panel shows a backwards 12-month moving average of IND. NBER-dated recessions are shaded in gray to illustrate cyclical movements in volatility. 12 The Journal of Finance