正在加载图片...

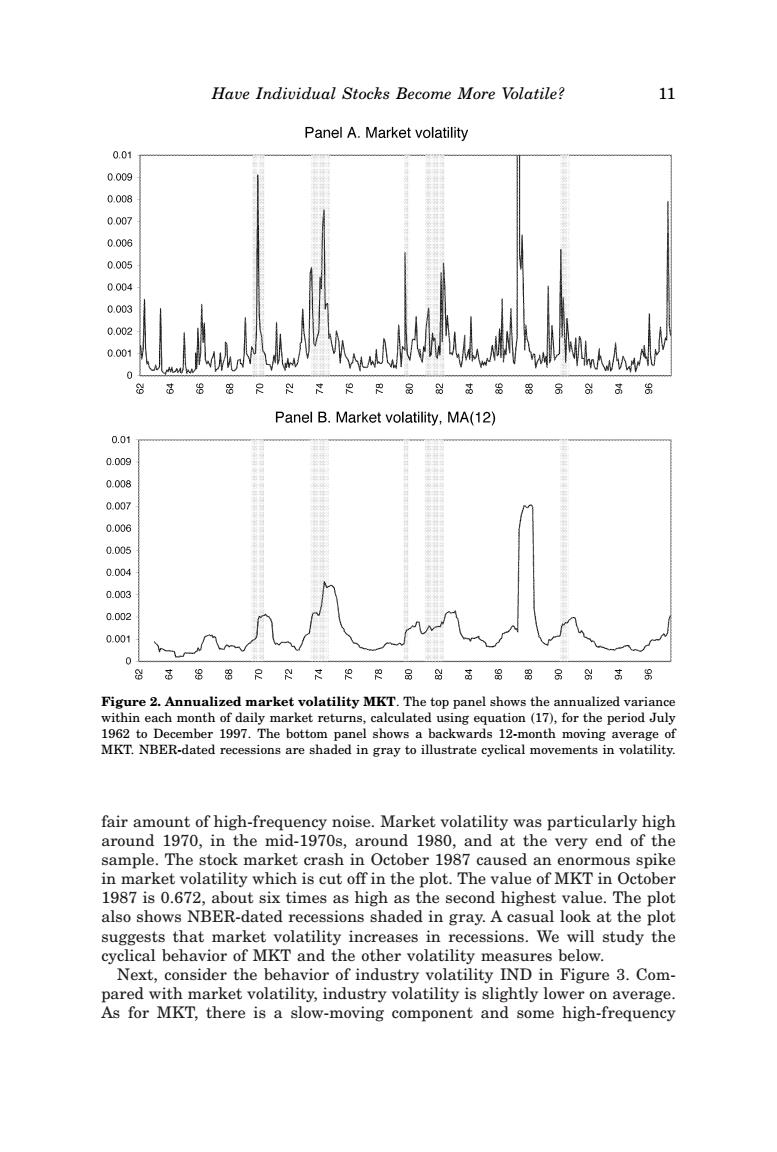
Have Individual Stocks Become More Volatile? 11 Panel A.Market volatility 0.01 0.009 0.008 0.007 0.006 0.005 0.004 0.003 0.002 0.00 WA 8 Panel B.Market volatility,MA(12) 0.01 0.009 0.008 0.007 0.006 0.005 0.004 0.003 0.002 0.001 0 器器只品高品留品高 Figure 2.Annualized market volatility MKT.The top panel shows the annualized variance within each month of daily market returns,calculated using equation(17),for the period July 1962 to December 1997.The bottom panel shows a backwards 12-month moving average of MKT.NBER-dated recessions are shaded in gray to illustrate cyclical movements in volatility. fair amount of high-frequency noise.Market volatility was particularly high around 1970,in the mid-1970s,around 1980,and at the very end of the sample.The stock market crash in October 1987 caused an enormous spike in market volatility which is cut off in the plot.The value of MKT in October 1987 is 0.672,about six times as high as the second highest value.The plot also shows NBER-dated recessions shaded in gray.A casual look at the plot suggests that market volatility increases in recessions.We will study the cyclical behavior of MKT and the other volatility measures below. Next,consider the behavior of industry volatility IND in Figure 3.Com- pared with market volatility,industry volatility is slightly lower on average. As for MKT,there is a slow-moving component and some high-frequencyfair amount of high-frequency noise. Market volatility was particularly high around 1970, in the mid-1970s, around 1980, and at the very end of the sample. The stock market crash in October 1987 caused an enormous spike in market volatility which is cut off in the plot. The value of MKT in October 1987 is 0.672, about six times as high as the second highest value. The plot also shows NBER-dated recessions shaded in gray. A casual look at the plot suggests that market volatility increases in recessions. We will study the cyclical behavior of MKT and the other volatility measures below. Next, consider the behavior of industry volatility IND in Figure 3. Compared with market volatility, industry volatility is slightly lower on average. As for MKT, there is a slow-moving component and some high-frequency Figure 2. Annualized market volatility MKT. The top panel shows the annualized variance within each month of daily market returns, calculated using equation ~17!, for the period July 1962 to December 1997. The bottom panel shows a backwards 12-month moving average of MKT. NBER-dated recessions are shaded in gray to illustrate cyclical movements in volatility. Have Individual Stocks Become More Volatile? 11