正在加载图片...

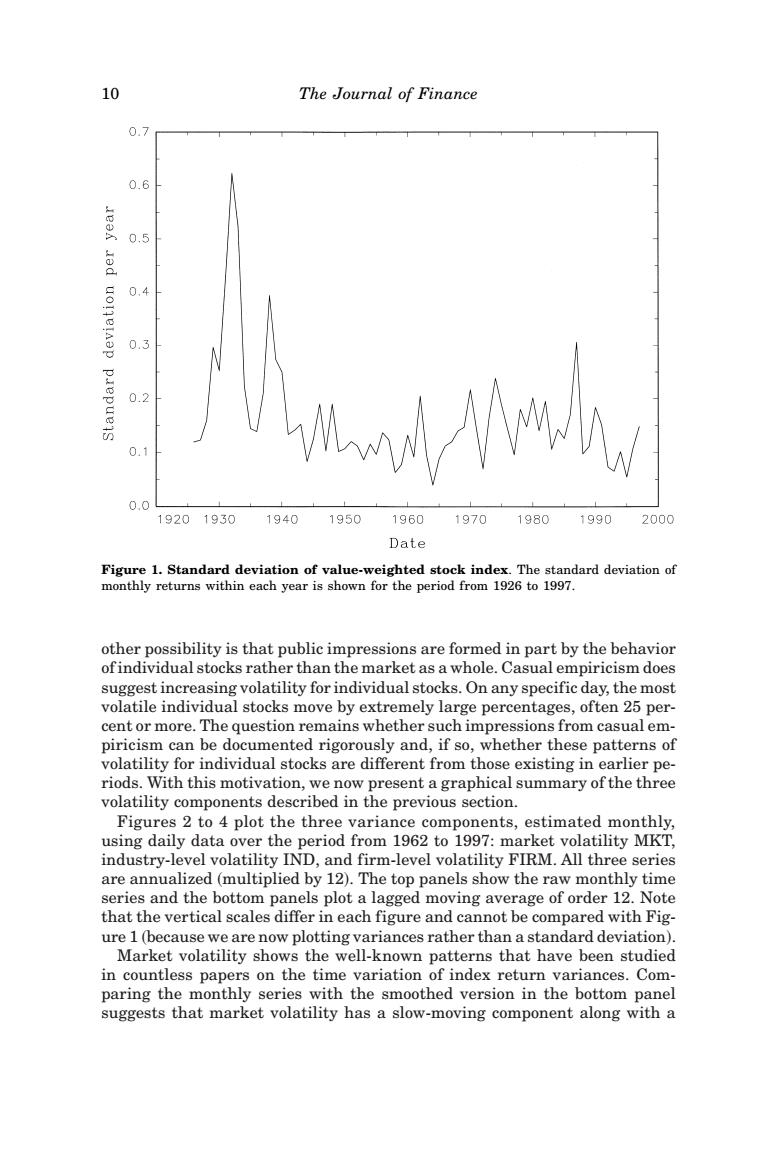
10 The Journal of Finance 0.7 0.6 0.5 0.4 0.3 0.2 0.1 0.0 19201950 1940 1950 1960 1970 1980 1990 2000 Date Figure 1.Standard deviation of value-weighted stock index.The standard deviation of monthly returns within each year is shown for the period from 1926 to 1997. other possibility is that public impressions are formed in part by the behavior ofindividual stocks rather than the market as a whole.Casual empiricism does suggest increasing volatility for individual stocks.On any specific day,the most volatile individual stocks move by extremely large percentages,often 25 per- cent or more.The question remains whether such impressions from casual em- piricism can be documented rigorously and,if so,whether these patterns of volatility for individual stocks are different from those existing in earlier pe- riods.With this motivation,we now present a graphical summary of the three volatility components described in the previous section. Figures 2 to 4 plot the three variance components,estimated monthly, using daily data over the period from 1962 to 1997:market volatility MKT, industry-level volatility IND,and firm-level volatility FIRM.All three series are annualized(multiplied by 12).The top panels show the raw monthly time series and the bottom panels plot a lagged moving average of order 12.Note that the vertical scales differ in each figure and cannot be compared with Fig- ure 1(because we are now plotting variances rather than a standard deviation) Market volatility shows the well-known patterns that have been studied in countless papers on the time variation of index return variances.Com- paring the monthly series with the smoothed version in the bottom panel suggests that market volatility has a slow-moving component along with aother possibility is that public impressions are formed in part by the behavior of individual stocks rather than the market as a whole. Casual empiricism does suggest increasing volatility for individual stocks. On any specific day, the most volatile individual stocks move by extremely large percentages, often 25 percent or more. The question remains whether such impressions from casual empiricism can be documented rigorously and, if so, whether these patterns of volatility for individual stocks are different from those existing in earlier periods. With this motivation, we now present a graphical summary of the three volatility components described in the previous section. Figures 2 to 4 plot the three variance components, estimated monthly, using daily data over the period from 1962 to 1997: market volatility MKT, industry-level volatility IND, and firm-level volatility FIRM. All three series are annualized ~multiplied by 12!. The top panels show the raw monthly time series and the bottom panels plot a lagged moving average of order 12. Note that the vertical scales differ in each figure and cannot be compared with Figure 1 ~because we are now plotting variances rather than a standard deviation!. Market volatility shows the well-known patterns that have been studied in countless papers on the time variation of index return variances. Comparing the monthly series with the smoothed version in the bottom panel suggests that market volatility has a slow-moving component along with a Figure 1. Standard deviation of value-weighted stock index. The standard deviation of monthly returns within each year is shown for the period from 1926 to 1997. 10 The Journal of Finance